
Figure 5. ECM stiffness is important for Nanog expression and its nuclear translocation.
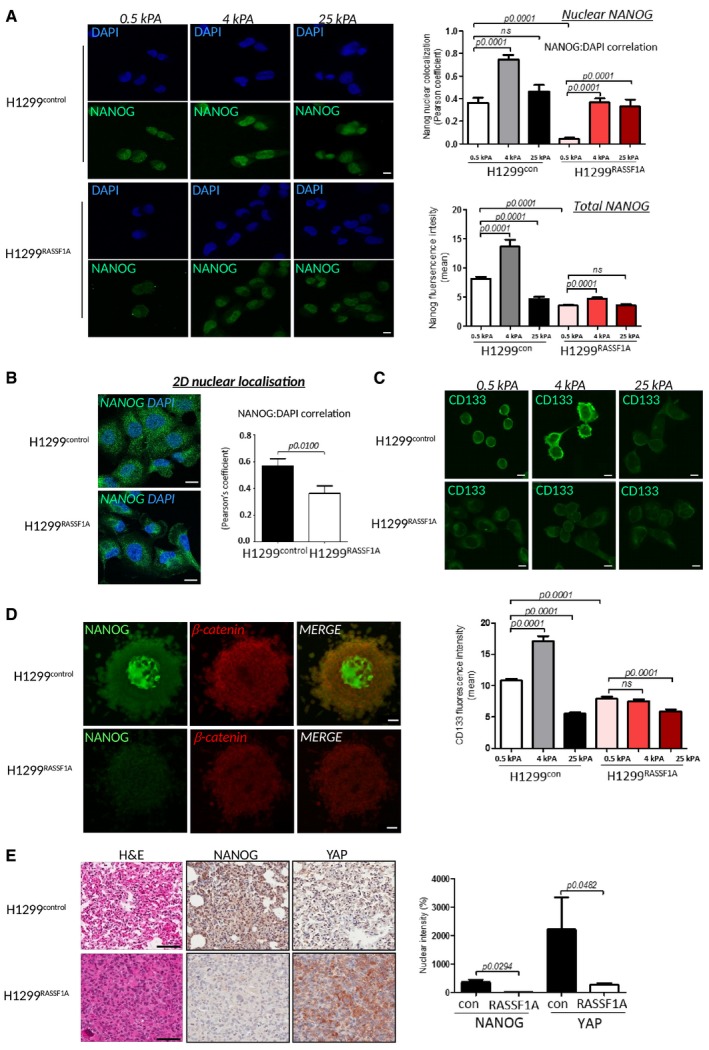
- Left: Representative images of H1299 cells on 3D collagen wells with defined stiffness with NANOG (green) or DAPI (blue). Scale bars: 10 μm. Right: Quantification of NANOG:DAPI nuclear co‐localization (upper graph) and total NANOG fluorescence intensity (bottom graph). Quantification of nuclear co‐localization (n = 300 cells/experiment) is represented by Pearson's coefficient.
- Representative immunofluorescence images show merge of NANOG (green), DAPI (blue) distribution in H1299control and H1299RASSF1A cells cultured on 2D glass. Scale bars: 10 μm. Right: Quantification of nuclear co‐localization (n = 200 cells/experiment) is represented by Pearson's coefficient.
- Representative immunofluorescence images of CD133 in H1299control and H1299RASSF1A cells grown on 3D collagen wells with defined stiffness. Scale bars: 10 μm. Bottom: Quantification of n = 200 cells/experiment.
- Representative images of immunofluorescence staining for the pluripotency marker NANOG and β‐catenin in three‐dimensional spheroids embedded in collagen matrix (2 mg/ml). Scale bars: 50 μm. Quantification in Fig EV4B.
- Representative images of H&E and immunohistochemical staining for NANOG and YAP1 in primary lung tumours (day 17). Scale bars: 100 μm. Right: Graph bars represent quantification of NANOG and YAP1 staining based on strong (3+, 2+) nuclear intensity (%) for at least two independent regions of n = 4 H1299control and n = 2 H1299RASSF1A primary tumours at day 17.