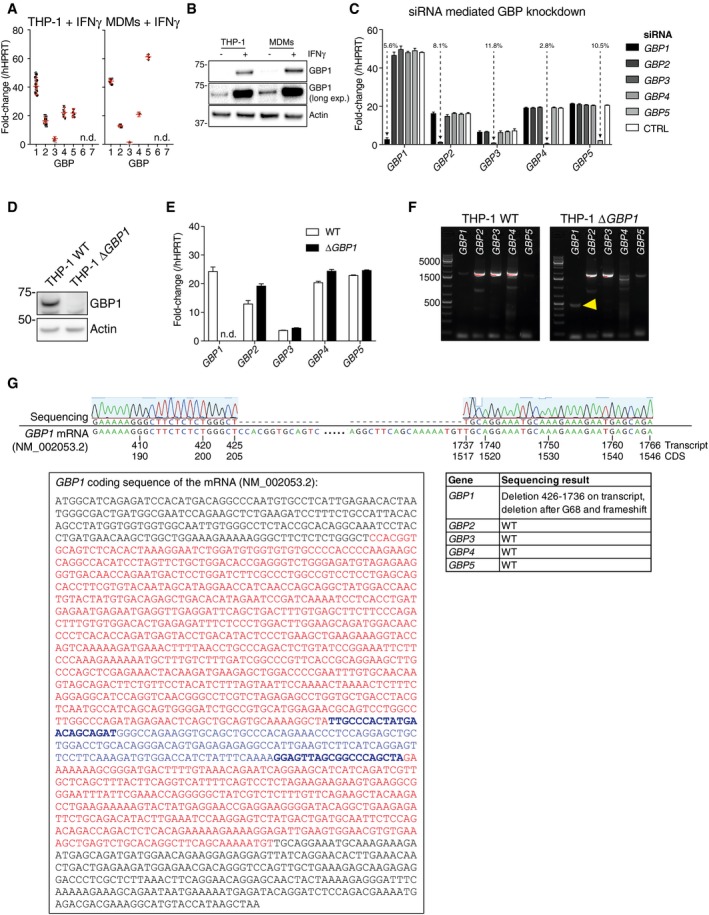
Figure EV1. Quality control of GBP ablation in THP‐1 cells.

- Fold‐change of mRNA of GBP1‐7 compared to hypoxanthine phosphoribosyltransferase 1 (HPRT1) in PMA‐differentiated THP‐1 cells (left) and primary MDMs (right) following treatment with IFNγ (50 IU/ml). Mean (red bar) ± SEM of n = 14 experiments (THP‐1) or n = 6 experiment (MDMs) shown; n.d. not detected.
- Immunoblots from differentiated THP‐1 WT or MDMs treated with IFNγ (50 IU/ml) or left untreated. Images represent n = 3 independent experiments.
- qRT–PCR measurement of silencing of expression of the indicated GBPs in IFNγ‐primed THP‐1 cells transfected with siRNA against GBP1‐5. mRNA fold‐change (mean ± SEM; n = 3 independent experiments) normalized to HPRT1 as percentage of cells transfected with non‐targeting control (CTRL) siRNA is indicated.
- Immunoblots from indicated THP‐1 cells treated with IFNγ. Images represent n = 3 independent experiments.
- qRT–PCR measurement of GBP1‐5 expression in THP‐1 and THP‐1 ΔGBP1 cells treated with IFNγ plotted as fold‐change to HPRT1. Mean ± SEM plotted from n = 3 experiments; n.d. not detected.
- RT–PCR amplification of GBP1‐5 coding sequences (CDS) from indicated THP‐1 cells treated with IFNγ. Yellow arrowhead indicates the truncated GBP1 CDS in the ΔGBP1 cells.
- Sequencing results showing loss of GBP1 coding region. Top: Needleman‐Wunsch alignment of GBP1 sequence from THP‐1 ΔGBP1 and GBP1 transcript sequence NM_002053.2 showing the deletion in knockout cells. Bottom left: GBP1 CDS with deletion highlighted in red. qRT–PCR primer binding sites marked in blue and bold letters and amplicon marked in blue. Bottom right: Summary table of sequencing result of GBP1‐5 in THP‐1 ΔGBP1 cells confirming loss of GBP1 and wild‐type coding sequences of GBP2‐5.
