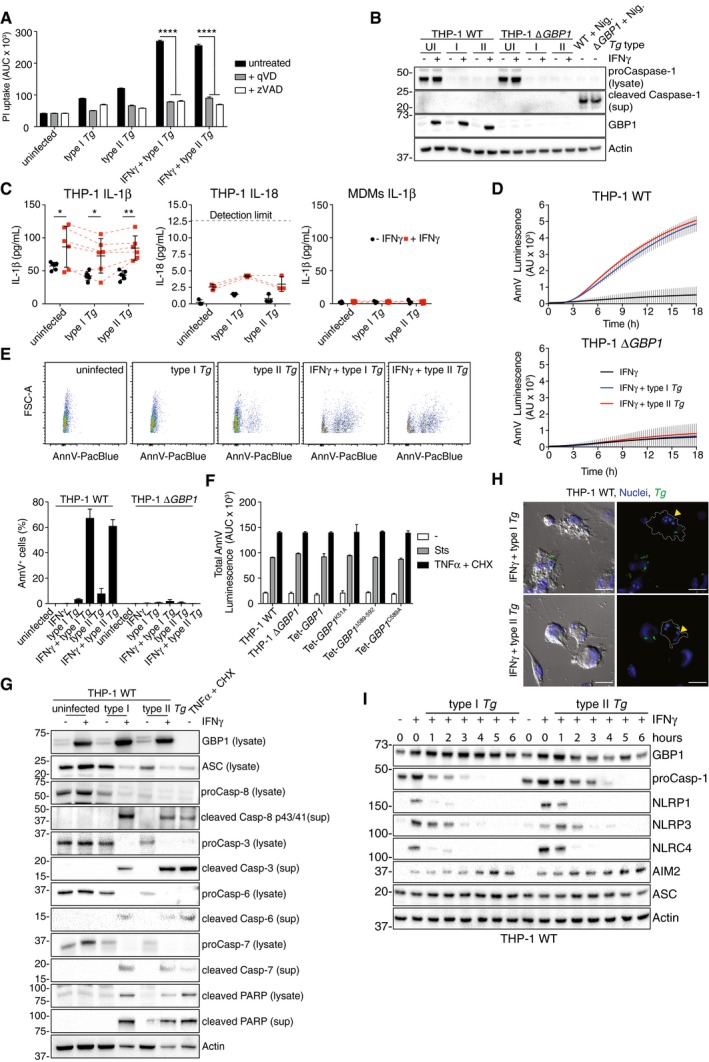
Propidium iodide (PI) uptake assay of naïve or IFNγ‐primed THP‐1 cells infected with either type I or type II Toxoplasma gondii (Tg) for 18 h in the absence or presence of pan‐caspase inhibitors zVAD‐fmk (25 μM) or qVD (20 μM). Area under the curve (AUC) from real‐time assay plotted as mean ± SEM from n = 3 independent experiments.
Immunoblots of the indicated proteins from THP‐1 WT or ∆GBP1 cells infected with type I and type II Tg for 6 h or left uninfected (UI). Cells were unprimed or primed with IFNγ as indicated. Cells were treated with Nigericin (Nig., 10 μM for 2 h) to activate the NLRP3–caspase‐1 pathway as a positive control. Images represent n = 3 independent experiments.
ELISA for IL‐1β (left) or IL‐18 (middle) from IFNγ‐primed THP‐1 cells or IL‐1β from primary MDMs infected with Tg for 24 h. Mean ± SEM are shown from n = 6 experiments (IL‐1β ELISA THP‐1), 3 experiments (IL‐18 ELISA THP‐1), and 4 donors of MDMs. Dashed lines for the +IFNγ data points indicate matching values from the same experiment.
Real‐time annexin V (AnnV)‐Glo assay from indicated IFNγ‐primed THP‐1 cells left uninfected or infected with type I or type II Tg for 18 h. Area under the curve (AUC) from real‐time assays plotted as mean ± SEM from n = 3 independent experiments.
Quantification of apoptosis by the AnnV‐staining assay in indicated THP‐1 cells infected with Tg. Upper panels show representative flow cytometry scatter plots of unprimed or IFNγ‐primed THP‐1 cells uninfected or infected with GFP‐expressing Tg strains as indicated. Cells were gated for single cells and GFP. Graph (below) shows the quantification (mean ± SEM from n = 3 independent experiments) of flow cytometry data of AnnV+ cells.
AnnV‐Glo assay of THP‐1 WT, ΔGBP1, and ΔGBP1 cells stably reconstituted with Tet‐wild‐type GBP1 or GBP1K51A, GBP1C589A, or GBP1Δ589–592 mutants as indicated, left untreated, or treated with Staurosporine (Sts) or TNFα + cycloheximide (TNFα + CHX) for 18 h. Area under the curve (AUC) from real‐time assays plotted as mean ± SEM from n = 3 independent experiments.
Immunoblot of IFNγ‐primed THP‐1 infected with type I or type II Tg for 12 h. As positive control, cells were treated with TNFα + CHX. Representative image of n = 2 experiments.
Representative immunofluorescence images of IFNγ‐primed THP‐1 WT cells infected with type I or type II Tg (gray) at 12 h post‐infection. Merged fluorescence and bright‐field image (left) and fluorescence only (right) are shown. Yellow arrowheads, apoptotic nuclei; Dotted line, cell outline; Gray, differential interference contrast; Blue, nuclei; Green, Tg. Scale bar, 20 μm.
Immunoblot of IFNγ‐primed THP‐1 infected with type I or type II Tg for the indicated time.
≤ 0.0001 in (A, C) from two‐way ANOVA following adjustment for multiple comparisons; ns, not significant.

