-
A
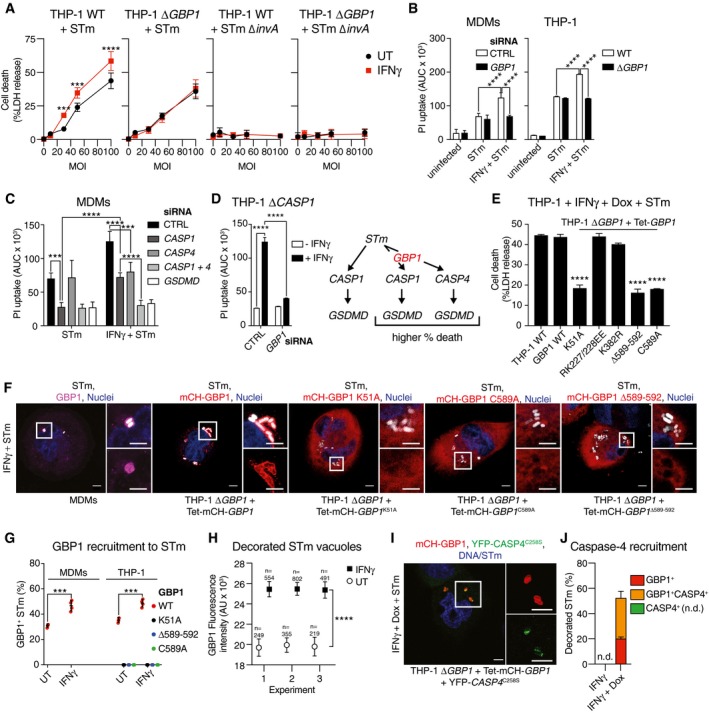
LDH release assay from the indicated THP‐1 cells untreated or treated with IFNγ and infected with Salmonella Typhimurium (STm) WT or a SPI‐1 mutant ΔinvA for 4 h at indicated multiplicities of infection (MOI). Mean ± SEM of n = 3 experiments are shown.
-
B
Propidium iodide (PI) uptake assay from IFNγ‐primed primary MDMs transfected with non‐targeting control siRNA (CTRL) or siRNA against GBP1 (left) or indicated THP‐1 cells (right) infected with STm‐GFP for 4 h. Area under the curve (AUC) from real‐time assay plotted as mean ± SEM from n = 3 independent experiments.
-
C
PI uptake assay from IFNγ‐primed primary MDMs transfected with indicated siRNA or non‐targeting control (CTRL) and infected with STm‐GFP for 4 h. Area under the curve (AUC) from real‐time assay plotted as mean ± SEM from n = 4 independent experiments.
-
D
PI uptake assay from IFNγ‐primed or untreated THP‐1 ΔCASP1 cells transfected with the indicated siRNA and infected with STm‐GFP for 4 h. Area under the curve (AUC) from real‐time assay plotted as mean ± SEM from n = 3 independent experiments. Schematic on right shows overview of the pathway leading to caspase‐1 and caspase‐4 activation.
-
E
LDH release assay from the indicated THP‐1 cells treated with IFNγ and Dox and infected with STm‐GFP for 4 h. Shown is the mean ± SEM of n = 3 experiments.
-
F, G
Representative images (F) and quantification (G) from IFNγ‐primed THP‐1 ΔGBP1 cells stably reconstituted with Tet‐mCH‐GBP1, mCH‐GBP1
K51A, mCH‐GBP1
C589A, or mCH‐GBP1
Δ589–592 variants or primary MDMs stained for endogenous GBP1. Cells were infected with STm‐GFP for 2 h. Blue, Nuclei; Gray, STm; Red, mCH‐GBP1; or Magenta, GBP1. Scale bar, 5 μm. Graph in (G) shows percentage of STm vacuoles targeted by GBP1.
-
H
Quantification of GBP1 recruitment to STm‐GFP‐containing vacuoles (SCV) in MDMs pre‐treated with IFNγ or left untreated (UT). Mean ± 95% CI of GBP1 fluorescence intensity measured on the indicated number (n) of SCVs for each condition from three independent experiments is shown. ****P < 0.0001 by nested t‐test.
-
I
Representative images from THP‐1 ΔGBP1 + Tet‐mCH‐GBP1 cells stably expressing YFP‐CASP4C258S. Cells were infected with STm for 2 h. Blue, Nuclei & STm (Hoechst dye); Red, mCH‐GBP1; Green, YFP‐CASP4C258S. Scale bar, 5 μm.
-
J
Quantification of THP‐1 ΔGBP1 + Tet‐mCH‐GBP1 cells stably expressing YFP‐CASP4C258S and infected with STm for 2 h. Graph shows percentage of STm vacuoles targeted by GBP1, CASP4, or both from n = 3 experiments. n.d. not detected.
≤ 0.0001 for indicated comparisons by two‐way ANOVA in (B–D, G), comparison between untreated and IFNγ‐treated in (A) or THP‐1 WT, and other genotypes in (E) by one‐way ANOVA following adjustment for multiple comparisons; ns, not significant.

