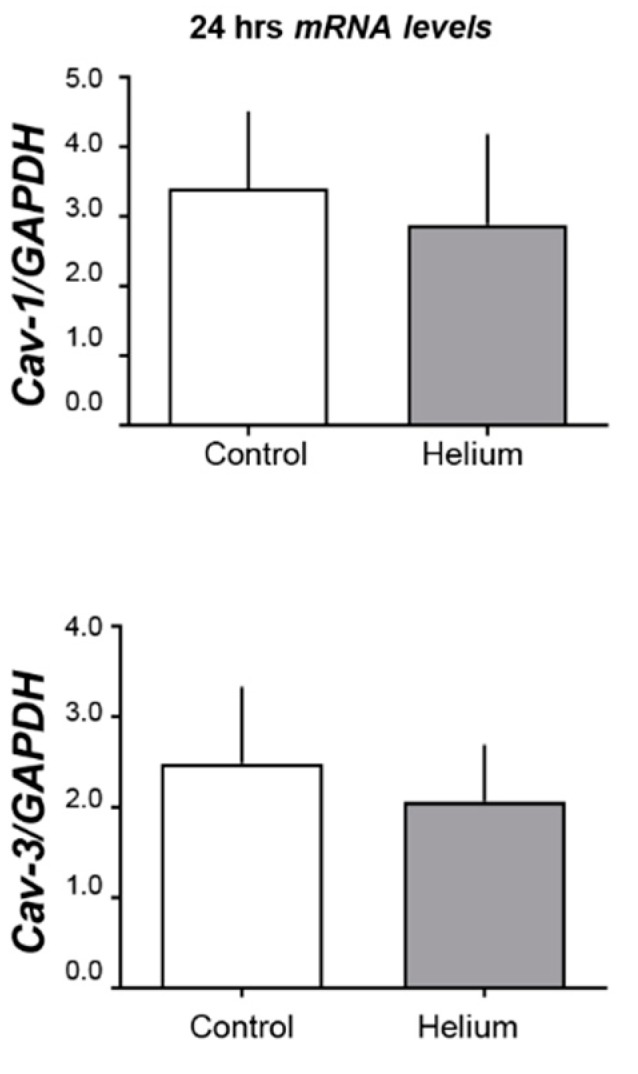
Figure 4.

Cav-1 and Cav-3 mRNA levels. Histogram shows the results of the real-time PCR experiments of mice whole-heart tissue. Upper panel is Cav-1 over GAPDH. and lower panel is Cav-3 over GAPDH (n = 5 for control and n = 6 for helium). No significant changes were observed, suggesting that the increase of Cav-3 in exosomes from PFP at this time point is not due to higher levels of Cav-3 gene expression but through a different mechanism, such as the direct release of Cav-3 from plasma membranes.
