Figure 5.
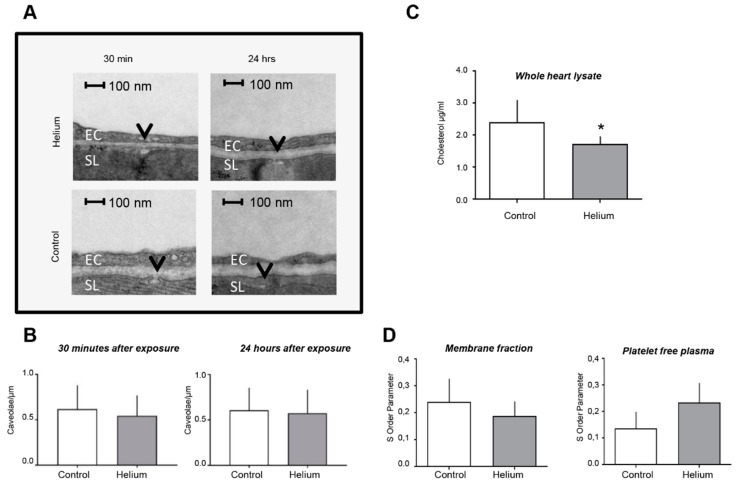
Assessment of cardiac ultrastructure and serum membrane fluidity post helium exposure. (A) Representative TEM images from left ventricular membranes of heart cells displayed per group, magnification 11,000 ×. Caveolae are indicated by the black arrow. EC: endothelial cell, SL: sarcolemma. No ultrastructural differences in cardiomyocytes were observed. (B) The number of caveolae in the sarcolemma of left ventricular myocytes are depicted as caveolae/µm for both time points, no significant differences were observed. All groups had the same sample size (n = 4 animals/group, n = 22–33 images acquired per animal). (C) Histogram shows the results of the cholesterol assay of whole-heart tissue in µM/mL. Twenty-four hours after helium exposure significantly less cholesterol was left in whole-heart tissue, n = 6 (control), n = 8 (helium). (D) The EPR histogram shows the changes in the S order parameter 24 h after He inhalation in membrane fractions and PFP, n = 4. The S order parameter is directly proportional to the membrane rigidity. No significant changes were observed. However, a trend towards decreased rigidity in the He group and increased rigidity in PFP can be appreciated when evaluating dedicated histograms. Data are shown as mean ± SD.

