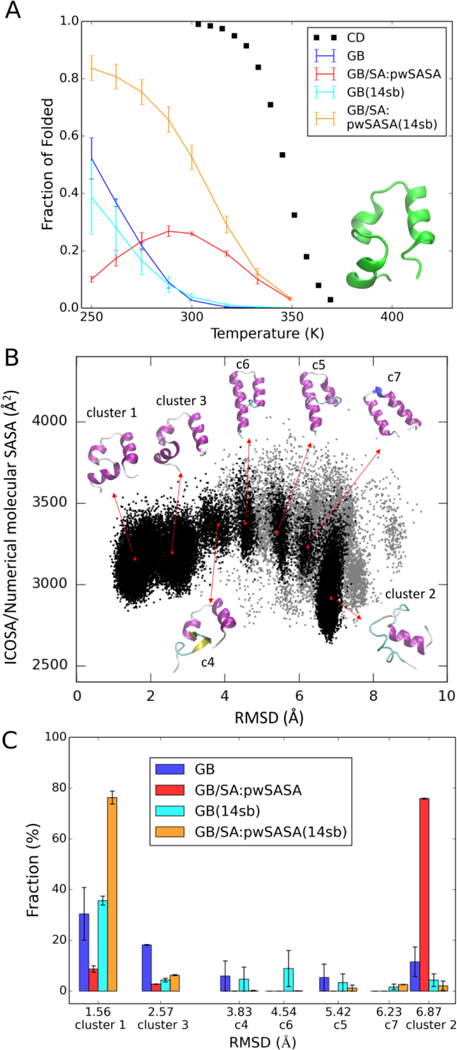
Figure 10.

HP36 melting curves and simulated structural equilibria using four models. (A) Thermal stability profiles for HP36 from experiment and calculated from GB and pairwise GB/SA REMD simulations using ff14SBonlysc and ff14SB. GB with ff14SBonlysc (denoted: GB) in blue, GB/SA with ff14SBonlysc (denoted: GB/SA: our method) in red, GB with ff14SB (denoted: GB(14sb)) in cyan, and GB/SA with ff14SB (denoted: GB/SA: our method (14sb) in orange. (B) 2D scatter plot of SASA versus Cα-RMSD excluding flexible termini for all structures in the combined 250K trajectories simulated using four models. Structures from the 7 most populated clusters are indicated with black dots; other structures are in gray. Representative structures from the top 7 clusters are colored by secondary structure and illustrated with arrows pointing from their corresponding (RMSD, SASA) coordinates shown as red dots. (C) Comparison of the top 7 cluster populations across four models. Each bar in the chart refers to the fraction (population) of a certain cluster in the simulated 250K trajectory using a certain model. The color scheme is the same as in (A). Cα-RMSD excluding flexible termini values and the cluster order are denoted on the x-axis. The error bars are calculated from the first and second halves of trajectories.
