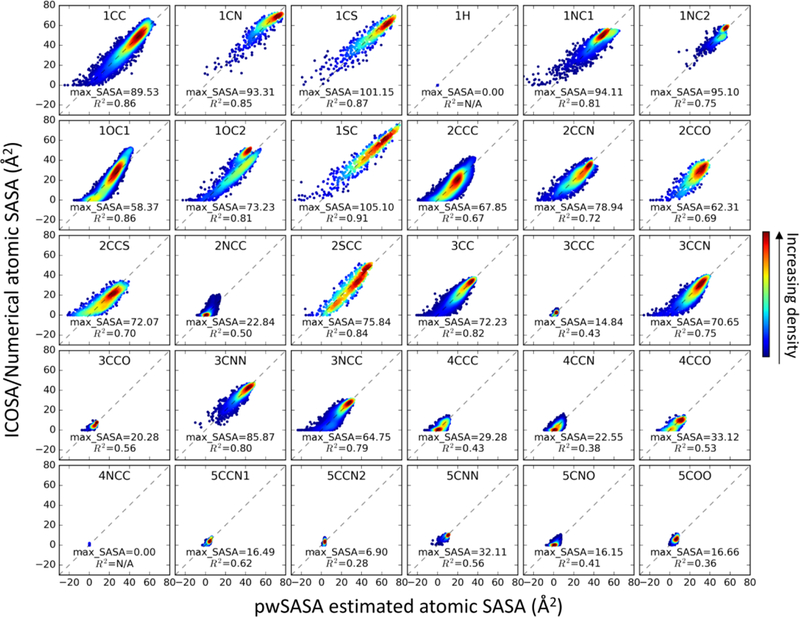
Figure 4.

2D histograms of pairwise atomic SASA of each pwSASA type, versus ICOSA-based numerical values in the training set. Perfect agreement would coincide with the diagonal dashed lines. The color indicates the kernel density estimated using scipy gaussian_kde73.
