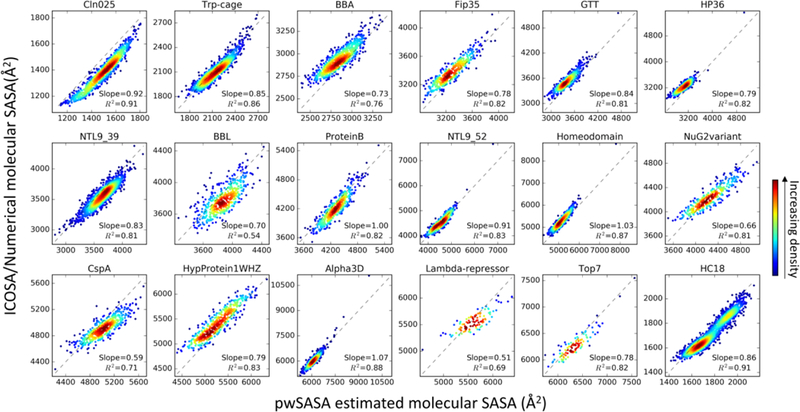
Figure 5.

2D histograms for each protein, showing fitted molecular SASA versus ICOSA numerical values for the test set. Perfect agreement is indicated by the diagonal dashed lines. The color indicates the kernel density estimated using scipy gaussian_kde73.
