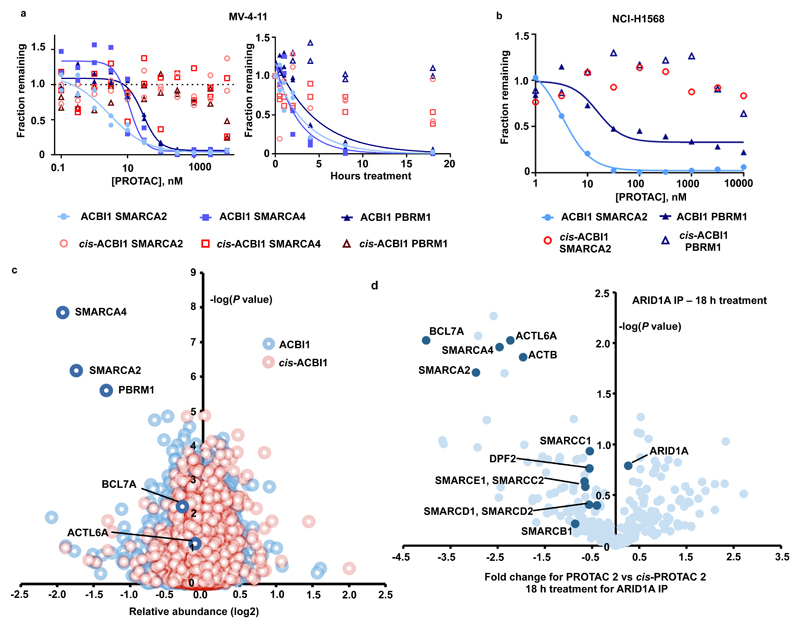
Figure 4. ACBI1 is a potent and selective degrader of SMARCA2, SMARCA4 and PBRM1.
a) Degradation of endogenous SMARCA2, SMARCA4 and PBRM1 in MV-4-11 cells treated for 18 h gave a DC50 of 6, 11 and 32 nM respectively (left). Time course of degradation in MV-4-11 in the presence of 1 µM of ACBI1 or 1 µM cis-ACBI1 (right). Two independent experiments. b) Degradation of endogenous SMARCA2 in NCI-H1568 cells treated for 18 h gave a DC50 of 3.3nM for SMARCA2 and 15.6 nM for PBRM1 Two independent experiments. c) Effects of ACBI1 (blue) and cis-ACBI1 (red) at 333 nM for 8 h on the proteome of MV-4-11 cells. Data plotted Log2 of the fold change versus DMSO control against –Log10 of the p value per protein from n = 3 independent experiments. All t-tests performed were two-tailed t-tests assuming equal variances d) SWI/SNF complexes were immuno-purified from MV-4-11 cell lysates following PROTAC treatment and abundance of subunits was determined by label free quantitation. Data plotted as fold change in abundance for PROTAC 2 vs cis-PROTAC 2 treatment against –Log10 of the p value per protein from n = 3 biologically independent experiments. Subunits of the SWI/SNF complex are highlighted. All t-tests performed were two-tailed t-tests assuming equal variances.

