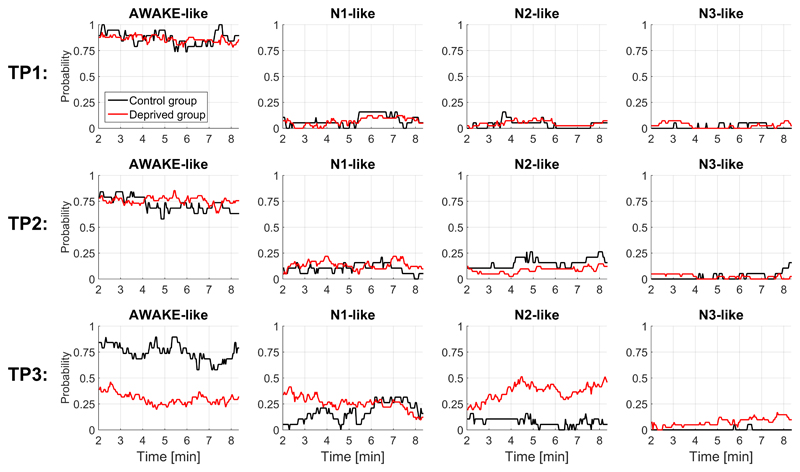
Figure 6. Prediction of wakefulness and sleep stages (N1, N2 and N3) based on the connectivity profiles of the continuous fMRI data showed increased sleep probability at TP3 in the deprived group.
We used the classifier from Tagliazucchi and Laufs (2014).

