
Fig. 2.
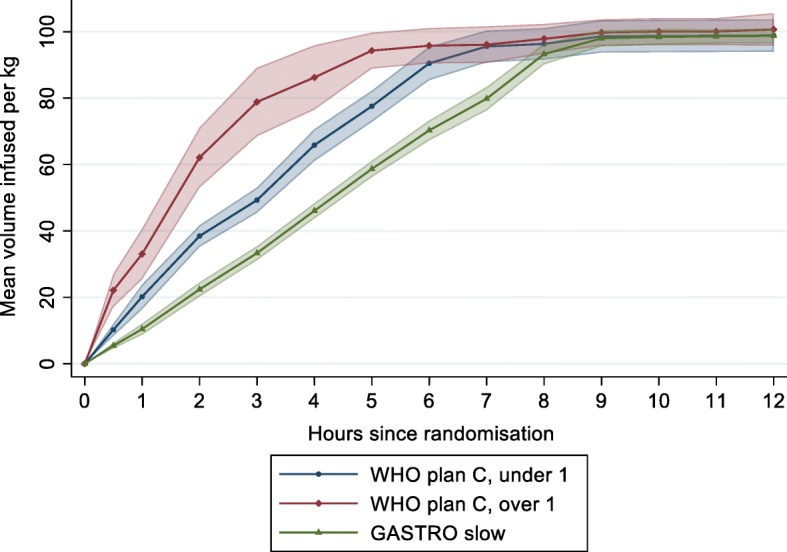
Mean volumes of fluid received during the first 12 h from randomisation. Mean volume (in millilitres per kilogramme) and 95% CI calculated at each time point (30 min, 1 h then hourly until 12 h)
Official websites use .gov
A
.gov website belongs to an official
government organization in the United States.
Secure .gov websites use HTTPS
A lock (
) or https:// means you've safely
connected to the .gov website. Share sensitive
information only on official, secure websites.
Mean volumes of fluid received during the first 12 h from randomisation. Mean volume (in millilitres per kilogramme) and 95% CI calculated at each time point (30 min, 1 h then hourly until 12 h)