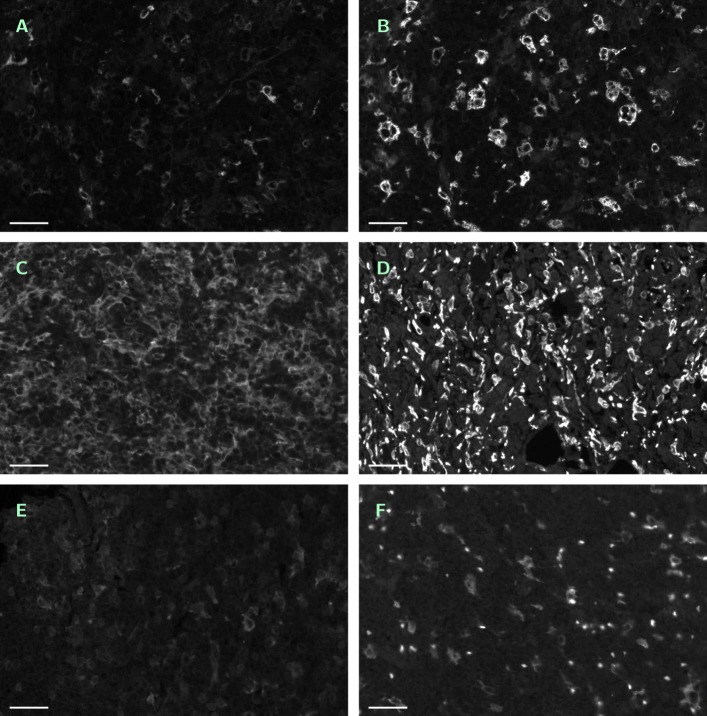
Fig. 1.
Six typical examples of single-channel ROIs. Contrast enhanced by factor 2 in all images, scale bar 45 μm. a — No. 11 (CD14 +/488 nm). b — No. 36 (CD163 +/555 nm), same region as in a. c — No. 01 (CD14 +/488 nm), tightly packed and squeezed macrophages. d — No. 28 (CD163 +/555 nm), tightly packed and squeezed macrophages, many erythrocytes. e — No. 12 (CD14 +/488 nm), weak contrast. f — No. 40 (CD163 +/555 nm), defocused and weakly stained macrophages, strongly autofluorescent erythrocytes

