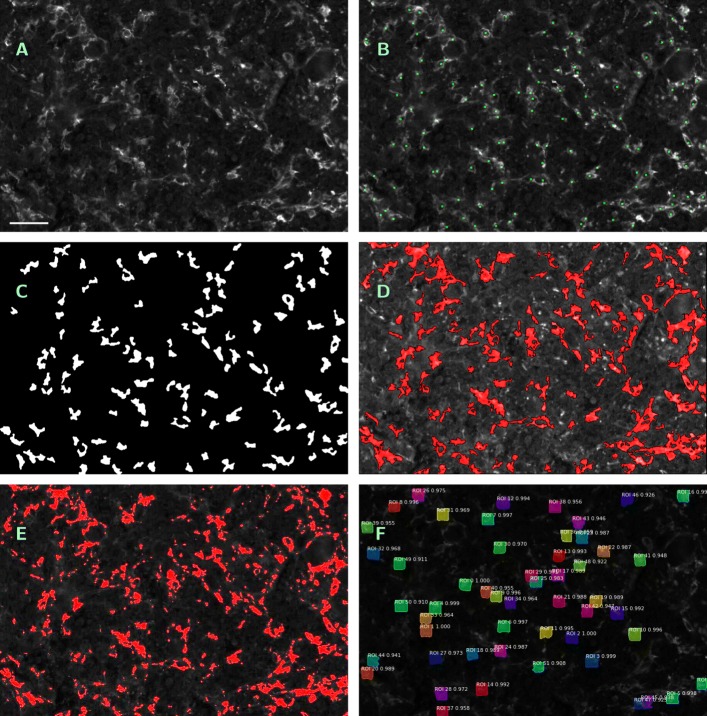
Fig. 4.
Visualization of outputs of different segmentation methods. a — Original single-channel image (ROI No. 09, CD14 +/488 nm), contrast enhanced by factor 3, scale bar 45 μm. b — Manual count within a; macrophages tagged with green squares. c — Output mask Isegm of ROF filter based segmentation (S1), (S2). d — Annotated image as output of software kit Tissue Studio (S3), contrast enhanced by factor 6, detected macrophage area in red. e — Annotated image as output of software kit Halo (S4), contrast enhanced by factor 3, detected macrophage area in red. f — Annotated image as output of machine learning method Mask R-CNN (S5)

