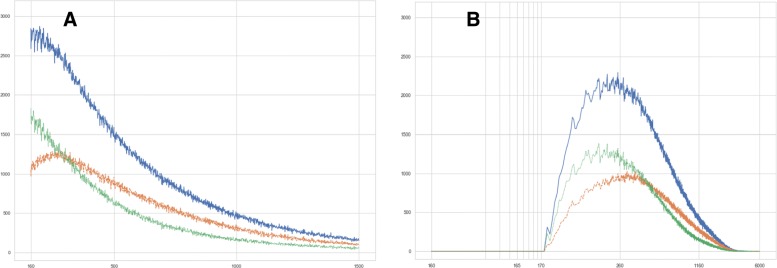
Fig. 5.
Histogram of feature sizes in tumor subregions, output of (S1), CD14 +/488 nm channel. a — x-axis: size of detected features (px), linear scale. y-axis: sum of feature counts over all 44 analyzed datasets. Blue: all features, green: features without double staining, yellow: features bearing double staining. b — x-axis: size of convex hulls of detected features (px), logarithmic scale. y-axis: sum of feature counts over all 44 analyzed datasets. Colors as before

