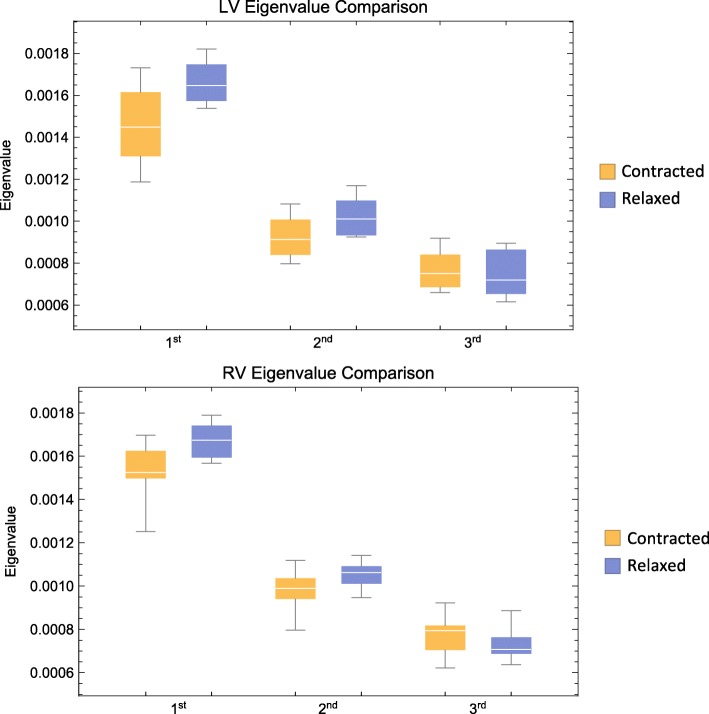
Fig. 13.
Eigenvalue comparison. Comparison of the three eigenvalues in the left ventricle. Box plot of eigenvalues of the first, secondary and tertiary eigenvectors. Means are calculated from all voxels in each individual heart. The plots are subsequently generated from summarizing the individual means within group. Boxes span the distance between the 0.25 and 0.75 quantiles surrounding the median with whiskers that span the full dataset

