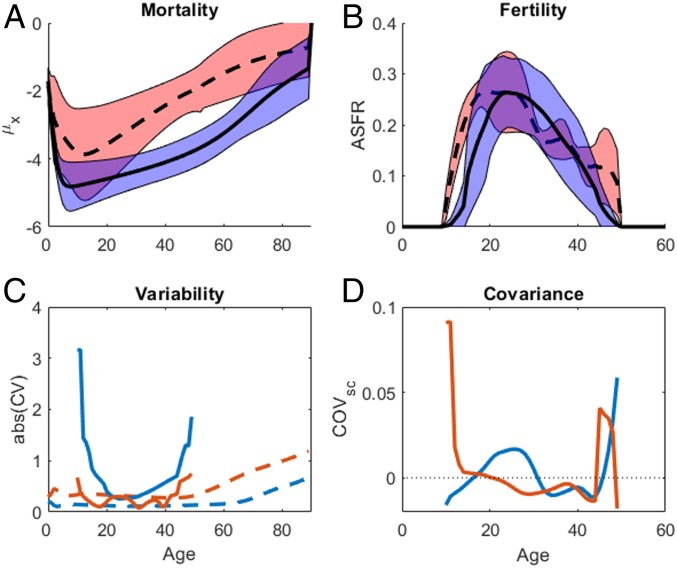
Fig. 1.
Vital rate statistics. Mean ± SD for (A) mortality μx and (B) fertility mx, across 10 small-scale societies (solid lines, blue fill) and five wild chimpanzee populations (dashed lines, red fill). (C) CVs for survival CV(px) (dashed lines) and fertility CV(mx) (solid lines) are calculated across humans (bold lines) and chimpanzees (thin lines). (D) Scaled covariance COVsc(px, mx) for humans (solid line, left y axis) and chimpanzees (dashed line, right y axis). The horizontal dotted line shows where COVsc crosses zero.

