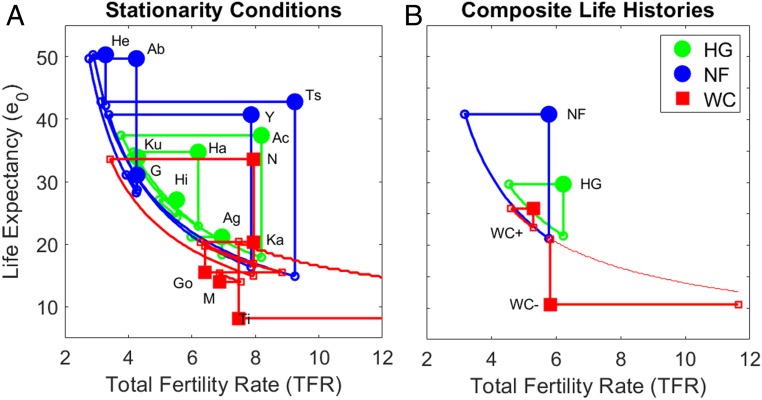
Fig. 2.
Stationarity conditions from vital rate alteration (scenario 1). (A) Conic sections delineate combinations of total fertility (TFR, x axis) and life expectancy (e0, y axis) reflecting vital rate changes that yield stationarity. Green and blue colors refer to hunter-gatherers and nonforagers, respectively. Red color is for chimpanzees. Large filled symbols indicate baseline conditions, small unfilled symbols indicate single-rate changes yielding stationarity, and connecting curves indicate stationarity isoclines under different vital rate combinations. Note that predictions for Taï fall beyond the axis bounds and indicate unfeasibly high fertility. Ab: Northern Territory Aborigines, Ac: Ache, Ag: Agta, G: Gainj, Ha: Hadza, He: Herero, Hi: Hiwi, K: Ju/’hoansi !Kung, Ts: Tsimane, Y: Yanomamo; Go: Gombe, K: Kanyawara, M: Mahale, N: Ngogo, and Ta: Taï. (B) Same as A but shown for mean rates calculated across all human samples (Hs), hunter-gatherers (HG), declining chimpanzee populations (C−), increasing chimpanzees (C+), and the mean chimpanzee life history.

