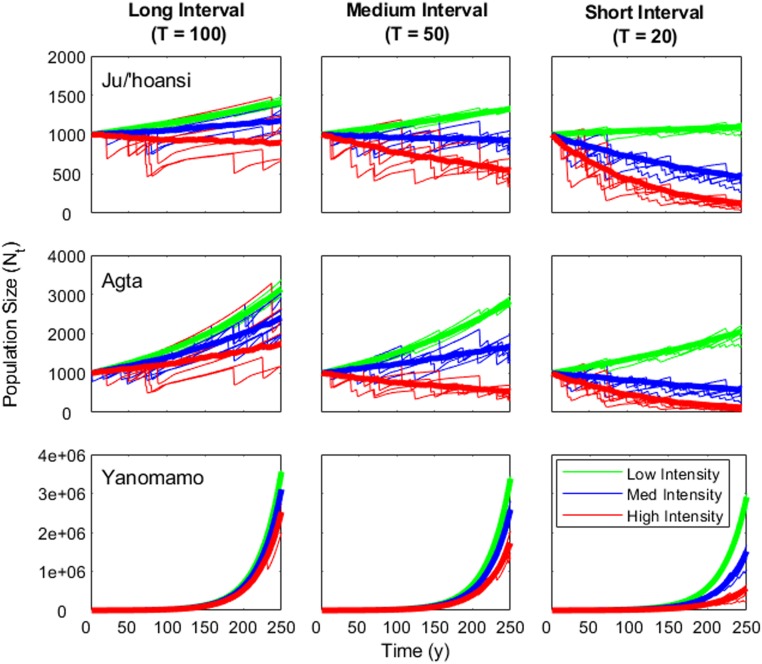
Fig. 3.
Population growth trajectories under stochastic catastrophes. Using three growing small-scale societies (Ju/’hoansi, top row; Agta, middle row; Yanomamo, bottom row) as examples, five random population growth trajectories are shown for each treatment, drawn from stochastic simulations with shock intervals (T) ranging from an average of 20 y to 100 y between shocks. Bold lines show means across 100 runs for each treatment. Line colors distinguish simulations with treatment applying catastrophe regimes of low (green: Zqc = 2, Zqa = 2), medium (blue: Zqc = 3, Zqa = 10), or high intensity (red: Zqc = 5, Zqa = 20).

