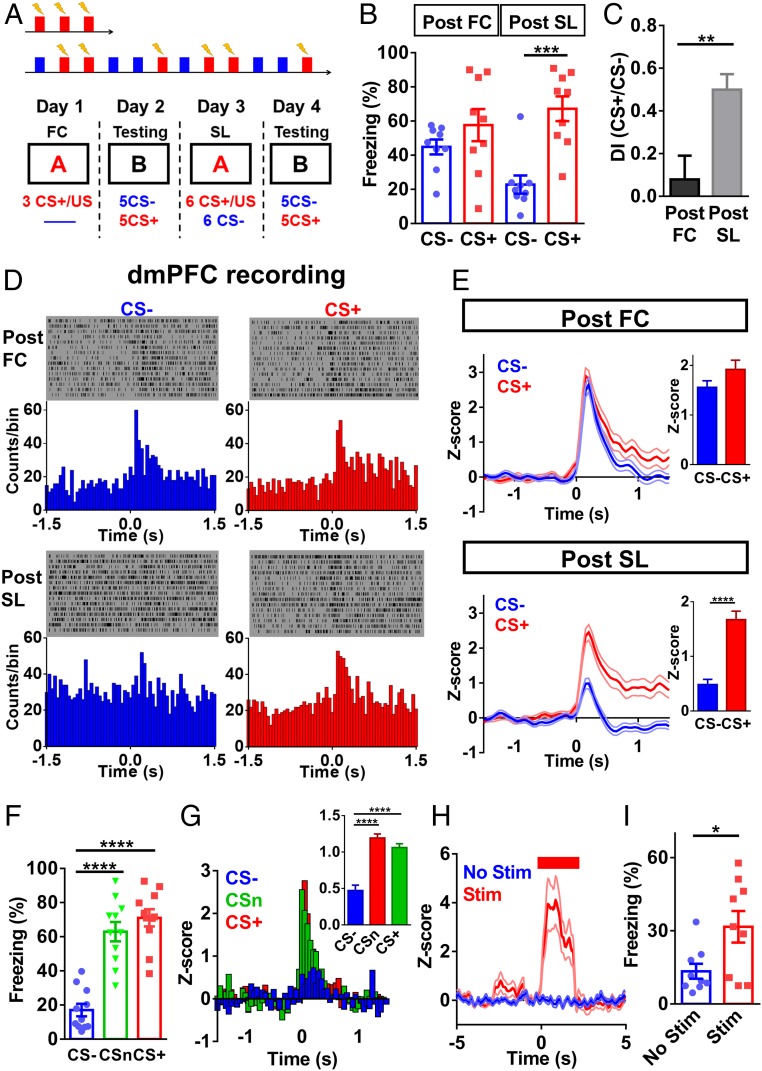
Fig. 1.
Differential fear responses and dmPFC neuronal activity associated with fear generalization and SL. (A) Experimental procedure for FC and SL. (B) Freezing levels during CS+ and CS− after FC and after SL [two-way repeated-measures (RM) ANOVA; interaction, F(1,8) = 12.62, P < 0.01; stimulus, F(1,8) = 16.37, P < 0.01; training, F(1,8) = 2.746, P = 0.136; n = 9 mice; post-FC, CS− vs. CS+, P = 0.15, post-SL, CS− vs. CS+, P < 0.001, Bonferroni’s posttest]. (C) Discrimination index post-FC and post-SL (two-tailed paired t test, t = 3.608, df = 8; n = 9 mice, post-FC vs. post-SL, P < 0.01). (D) Sample recording of dmPFC neuronal spikes post-FC (Upper) and post-SL (Lower). (E) Population data on dmPFC neuronal spike change post-FC (Upper) and post-SL (Lower), with corresponding average z-scores (two-tailed paired t test; post-FC, t = 1.856, df = 49; post-SL, t = 10.95, df = 49; n = 50 units/11 mice; post-FC, CS− vs. CS+, P = 0.07; post-SL, CS− vs. CS+, P < 0.0001). In this and subsequent figures, thick lines represent mean and thin lines represent SEM. (F) Fear suppression was selective to CS− after SL [one-way RM ANOVA, F(2, 20) = 40.18, P < 0.0001; n = 11 mice, CS− vs. CSn, P < 0.0001; CS− vs. CS+, P < 0.0001; CSn vs. CS+, P = 0.82, Bonferroni’s posttest]. (G) Smaller dmPFC neuronal spike change occurred only during CS− after SL [one-way RM ANOVA, F(2, 72) = 46.52, P < 0.0001; n = 37 units/7 mice; CS− vs. CSn, P < 0.0001; CS− vs. CS+, P < 0.0001; CSn vs. CS+, P = 0.28, Bonferroni’s posttest]. (H) Electrical stimulation in the dmPFC elevated dmPFC spiking (n = 30 units/7 mice). (I) Elevated freezing level during electrical stimulation in dmPFC (two-tailed paired t test, t = 2.57, df = 8; n = 9 mice, no stim vs. stim, P < 0.05). *P < 0.05; **P < 0.01; ***P < 0.001; ****P < 0.0001. Data represent mean ± SEM.

