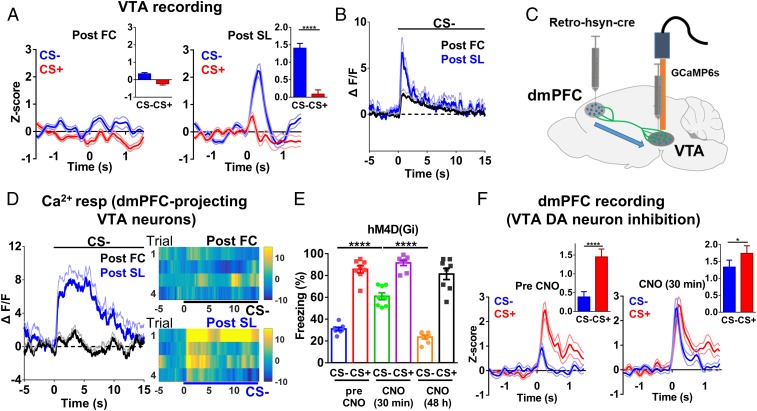
Fig. 4.
VTA DA neurons are selectively activated by CS− after SL. (A) Population spike change in VTA neurons after FC (Left) and after SL (Right) (two-tailed paired t test; post-FC, t = 1.004, df = 32; post-SL, t = 7.857, df = 32; n = 33 units/5 mice; post-FC, CS− vs. CS+, P = 0.32; post-SL, CS− vs. CS+, P < 0.0001). (B) Peri-event plot of averaged Ca2+ responses during CS− post-FC and post-SL (two-tailed paired t test, t = 3.554, df = 11; n = 12 mice; post-FC vs. post-SL, P < 0.01). (C) Schematic illustration of recording Ca2+ responses in dmPFC-projecting VTA neurons. (D) Averaged Ca2+ responses during CS− post-FC and post-SL (two-tailed paired t test, t = 5.211, df = 6; n = 7 mice; post-FC vs. post -SL, P < 0.01). (E) Freezing levels during CS− after CNO injection [two-way RM ANOVA; interaction, F(2,14) = 13.53, P < 0.001; stimulus, F(1,7) = 387.1, P < 0.0001; treatment, F(2,14) = 39.11, P < 0.0001; n = 8 mice, CS− (pre CNO) vs. CS− (CNO 30 min), P < 0.0001; CS− (CNO 30 min) vs. CS− (CNO 48 h), P < 0.0001, Bonferroni’s posttest]. (F) Spike change of dmPFC neurons before (Left) and 30 min after (Right) CNO injection [two-tailed paired t test; pre-CNO, t = 7.373, df = 20; CNO (30 min), t = 2.534, df = 20; n = 21 units/5 mice; pre-CNO, CS− vs. CS+, P < 0.0001; CNO (30 min), CS− vs. CS+, P < 0.05].

