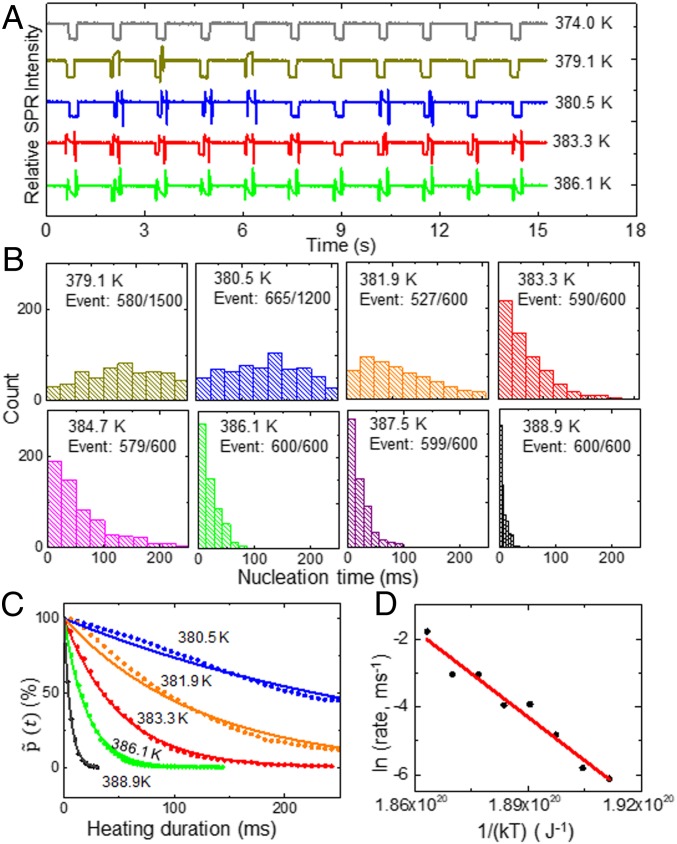
Fig. 3.
(A) Representative SPR intensity curves under different laser powers (local temperatures). (B) Histograms of nucleation time distribution at 379.1, 380.5, 381.9, 383.3, 384.7, 386.1, 387.5, and 388.9 K, respectively. The fractions given in the histograms indicate the percentage of successful bubble events at each temperature. (C) Fitting the probability as a function of time reveals the temperature-dependent nucleation rate. (D) Logarithm of the nucleation rate linearly decreases with 1/(kT), allowing for determining the activation energy barrier Ea from the Arrhenius equation.

