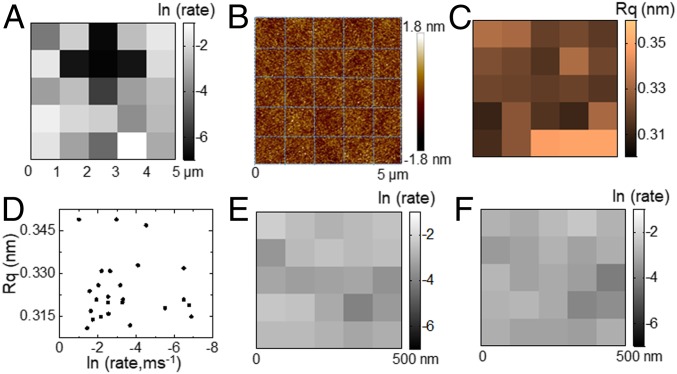
Fig. 4.
(A) Map of the logarithm of bubble nucleation rate constant, ln (rate, ms−1), in a 5 × 5-μm2 area with a step size of 1 μm. (B) AFM image of the very same 5 × 5-μm2 area after SPRM experiments. The blue lines divide the area into 25 segments. (C) Map of the Rq of each segment. (D) No correlation is observed between the rate constant, ln (rate), and the Rq in 25 segments. (E and F) Map of ln (rate) in a 500 × 500-nm2 region with a step length of 100 nm in two consecutive scans to demonstrate the repeatability of mapping.

