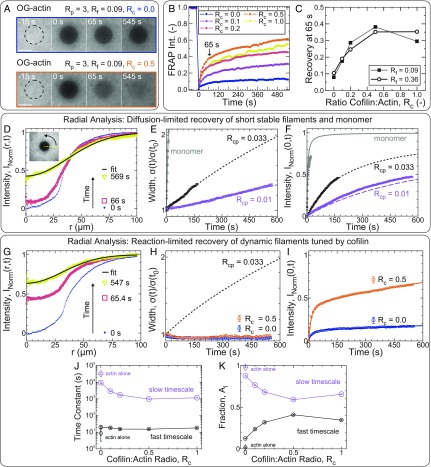
Fig. 2.
Cofilin enhances reaction-limited reorganization dynamics in entangled actin solutions. (A–K) Unless otherwise indicated, all samples are polymerized from 11.9 µM Mg–ATP–actin [5% Oregon Green (OG)-labeled]. (A) Confocal fluorescence time-lapse micrographs for samples with Rp = 3, Rf = 0.09, and Rc = 0 (Upper) or Rc = 0.5 (Lower) at steady state. Dashed black circles denote the region exposed to the bleaching laser. Time is relative to the end of the 4-s bleach. (Scale bars: 50 µm.) (B and C) FRAP analysis of the bleached region for samples with variable cofilin and formin concentrations (all with Rp = 3). (B) Time course of the normalized fluorescence intensity (Int.) averaged across the bleached region for entangled solutions with Rc as indicated in the key and Rf = 0.09. (C) Actin fluorescence intensity recovered within 65 s of bleaching (denoted by arrow in B) as a function of cofilin concentration with either Rp = 0.09 (filled squares) or Rp = 0.36 (open circles). Each point represents a single experiment. (D–K) Radial FRAP analysis of actin assembled in the presence of either capping protein (D–F: Rcp = 0.01 or 0.033; Rp = Rc = Rf = 0) or profilin, formin, and variable cofilin (G–K: Rp = 3; Rf = 0.09; Rc as indicated; Rcp = 0). Gray lines (E and F) and open triangles (E and F) refer to 0.52 µM unassembled Ca–ATP actin monomer (53% Oregon Green-labeled) in G buffer in the absence of regulatory proteins. (D and G) Normalized, azimuthally averaged fluorescence intensity profiles at different times postbleach assembled in the presence of capping protein (D: Rcp = 0.01; Rp = Rc = Rf = 0) or cofilin (G: Rcp = 0; Rp = 3; Rc = 0.5; Rf = 0.09). Solid black line is a Gaussian fit to the last profile. D, Inset depicts the azimuthal averaging process. Time evolution of the normalized profile widths and postbleach intensities at the center of the bleached regions, as extracted from the Gaussian fits, are plotted in E and H, and F and I, respectively. (E, F, H, and I) Symbols are parameters obtained from Gaussian fits to radial profiles [squares: Rp = Rc = Rf = 0 with Rcp = 0.01 (lavender) or 0.033 (black); circles: Rcp = 0, Rp = 3, Rf = 0.09, with Rc = 0 (orange) or 0.5 (blue); triangles (gray): monomer with Rp = Rc = Rf = Rcp = 0]. (E, F, and H) Lines are the width (E and H) or central intensity (F) trajectories expected for dilute, monodisperse solutions of diffusing particles. The solid gray line (E and F) is a fit-free prediction for monomer-sized spheres, while the short-dashed black and long-dashed lavender lines are fits to the width time course for samples with Rcp = 0.033 and 0.01, respectively (E). Lines in F are predictions (not fits) for either monodisperse solutions of monomers (gray) or cylinders (black and lavender) with the effective lengths obtained from E. (I) Solid lines are double-exponential fits to the central intensity recovery trajectories of samples with cofilin. Time constants (J) and amplitude fractions (K) obtained from double-exponential fits like those in I are plotted as a function of Rc. Large lavender and small black symbols denote the fit parameters associated with the slow and fast timescales, respectively. (J and K) Solid lines are a guide to the eye. Disconnected diamonds are parameters obtained from a double-exponential fit for an actin-only sample (Rc = Rp = Rf = Rcp = 0).

