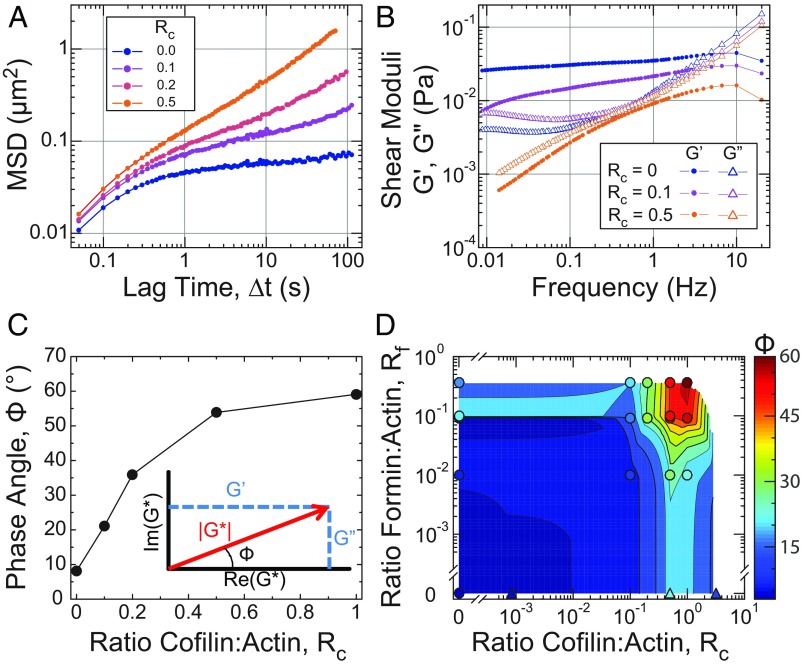
Fig. 3.
Cofilin-mediated turnover tunes the steady-state fluidity of entangled F-actin solutions. All microrheology measurements are of steady-state entangled actin solutions polymerized from 11.9 µM Mg–ATP–actin (0% or 5% Oregon-Green labeled) with Rp = 3 (35.7 µM), Rf = 0.09 (1.07 µM), and Rc as indicated, except for D, where Rf is as indicated, and Rp = 0 for samples denoted by triangles. (A) Ensemble-averaged MSD of 1-µm-diameter beads with Rc as indicated in the key. Each point is calculated from at least 1,000 displacements from a single sample. (B) Real and imaginary components of the complex shear modulus (G′ and G′′, respectively) for the Rc = 0, 0.1, and 0.5 samples from A, denoted by filled circles (G′) and open triangles (G″), respectively. (C) Phase angle (Φ) evaluated at 0.1 Hz for conditions with Rc as indicated. (C, Inset) Geometric relationship between the magnitude of the complex shear modulus (|G*|; red), its real and imaginary components (G′ and G″; blue), and the phase angle (Φ), shown in the complex plane. (D) State diagram displaying the phase angle (Φ; color) evaluated at 0.1 Hz for entangled solutions with Rf and Rc as indicated and Rp = 3 (circles) or 0 (triangles). In most cases, each point represents a single sample, although some are the average of multiple samples. The heatmap represents a 2D interpolation of the discrete data points.

