Fig. 3.
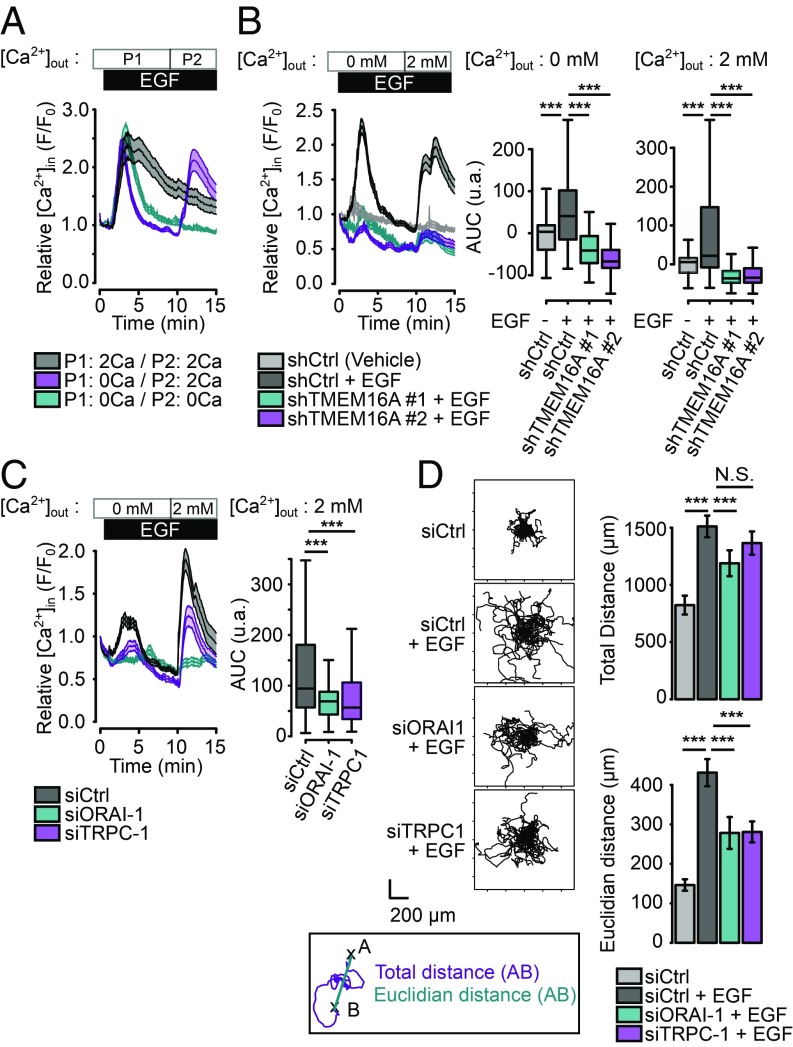
EGF induces a SOCE involving ORAI-1 and TRPC1 channels. (A) Relative Ca2+ influx (F/F0) in AsPC-1 cells treated with EGF (50 ng/mL) in a Ca2+-free buffer (blue) for 15 min, in a 2 mM Ca2+ buffer (gray) for 15 min or in Ca2+-free buffer for 10 min followed by a 2 mM Ca2+ buffer for 5 min (magenta). Data are mean ± SEM from two to four independent experiments regrouping 95–155 cells per condition (t test: ***P < 0.001). (B and C) Relative Ca2+ influx (F/F0) in control (shCtrl) and TMEM16A-silenced (shTMEM16A #1, shTMEM16A #2) AsPC-1 cells and in control (siCtrl) or AsPC-1 silenced for ORAI-1 (siORAI1), TRPC-1 (siTRPC1) treated with EGF (50 ng/mL) in a Ca2+-free buffer for 10 min and a 2 mM Ca2+ buffer for 5 min. Boxplots represent the corresponding integrative fluorescence signal observed from three to five independent experiments regrouping 110–284 cells per condition (t test: ***P < 0.001). (D) EGF-induced cell migration is dependent of ORAI-1 and TRPC1 channels. (Left) Representative 12-h time lapse tracking plots from control (siCtrl) treated or not with EGF and AsPC-1 silenced for ORAI-1 (siORAI1), TRPC-1 (siTRPC1) treated with EGF. (Right) Corresponding histograms quantifying motility parameters (total length and the Euclidian distance traveled per cell). Values are mean ± SEM recapitulating the tracking of 23–25 cells (from two to three independent experiments). (Mann–Whitney test: *P < 0.05, **P < 0.01, ***P < 0.001, N.S. P > 0.05.)

