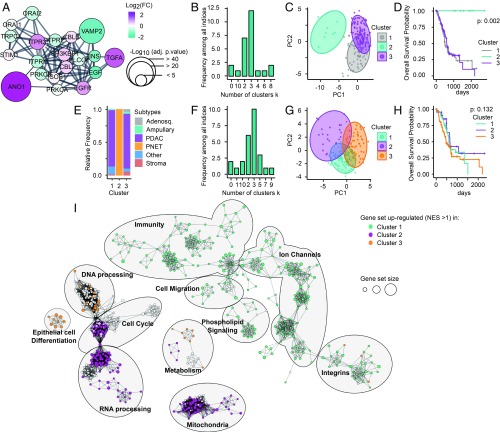
Fig. 6.
Classification of pancreatic cancer samples into four clusters using EGF-induced TMEM16A-dependent Ca2+ signaling genetic signature. Genes involved in the EGF-induced TMEM16A-dependent Ca2+ signaling are selected to serve as a signature to classify patients in various clusters. (TMEM16A, EGF, TGFA, EGFR, ORAI1, TRPC1, STIM1, ITPR1, ITPR2, ITPR3). (A) Enrichment of the gene set by the addition of 10 of their closet interactors (confidence = 0.8) using StringApp from Cytoscape mapped with log2(FC) intensity (color) and negative log10 of adjusted P value (size) obtained from the differential expression analysis between pancreatic cancer with low or high TMEM16A expression. (B) Determination of the optimal number of clusters using “NbClust” package on the transcriptomic data obtained from the TCGA-PAAD dataset and restricted to our gene set defined in A. (C) PCA representation of pancreatic cancer samples from TCGA-PAAD dataset restricted to our gene set mRNA expression and mapped with the unsupervised K-means clusterization of these samples into three clusters. (D) Kaplan–Meier survival of patients according their classification into three clusters defined in B. (E) Histogram representing the distribution of TCGA-PAAD samples according the histopathological subtypes defined (19) and in function of clusters defined in C. (F) Determination of the optimal number of clusters using “NbClust” package on the transcriptomic data obtained from the TCGA-PAAD dataset removed from PNET-associated samples and restricted to our gene set defined in A. (G) PCA representation of pancreatic cancer samples from TCGA-PAAD dataset removed from PNET-associated samples restricted to our gene set mRNA expression and mapped with the unsupervised K-means clusterization of these samples into three clusters. (H) Kaplan–Meier survival of patients according their classification into three clusters defined in F. (I) Using the TCGA-PAAD dataset cleared from PNET-associated samples, the ranked list of DEGs for each cluster (obtained by DEA comparing each cluster against two others) was submitted to the GSEA and then visualized as network with the EnrichmentMap app of Cytoscape (FDR P < 0.01). Nodes represent each gene set/GO functions. Node size represents the number of genes in each gene set/GO. One color was applied for each cluster to gene set/GO that conditionally have a normalized enrichment score (NES) value > 1 in this cluster and a NES value < 1 in two others.

