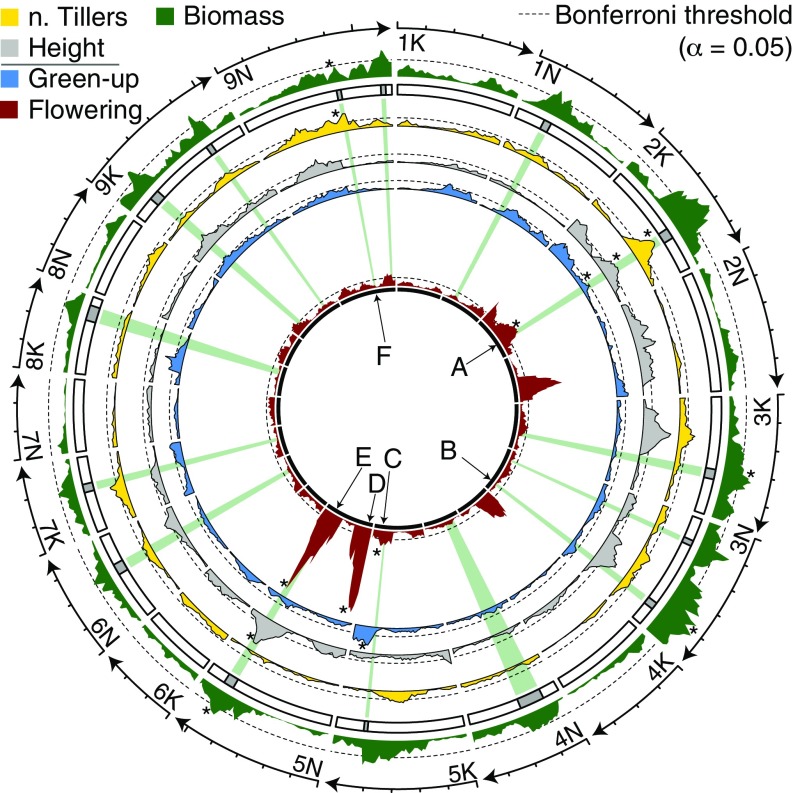
Fig. 2.
Mapping positions of QTL across five traits. −log10 P value support for QTL is plotted in each track, where the mapping position (centimorgans) is the x axis. Each minor tick on the outer segments indicates 20-cM distance. The primary phenotype, biomass, is presented along the outer track on its own scale. The remaining four phenological and morphologic traits are all on an identical scale. All significant QTL are highlighted from the center as gray rays. Six focal QTL (A–F) are indicated with arrows. The genotypic effects of these QTL are plotted in Fig. 3 following this naming scheme. All significant QTL for each trait are indicated by an asterisk. Plot includes data analyzed across both 2016 and 2017.

