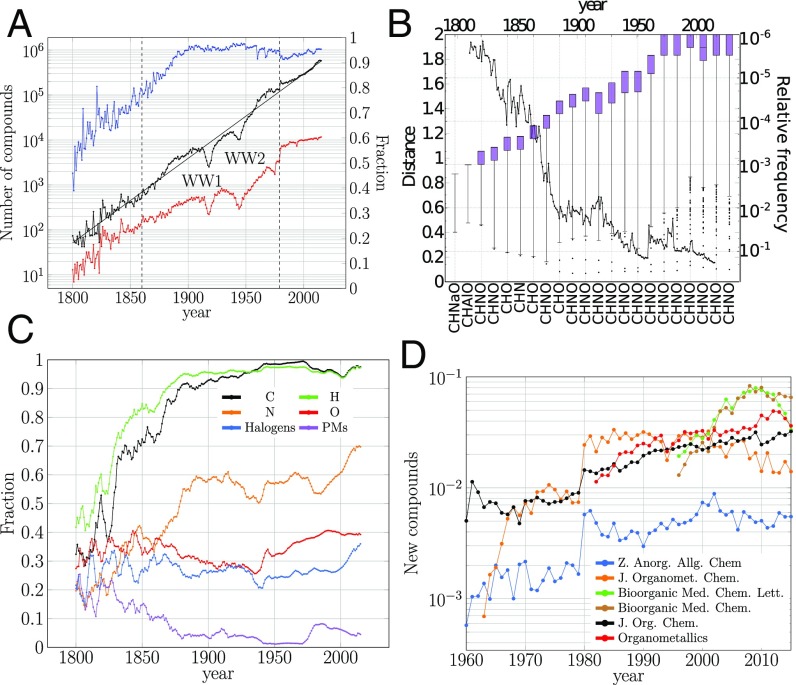
Fig. 1.
Growth of compounds. (A) Annual number of new compounds (black) and plot of the fitted equation (left axis [l.a.]; Materials and Methods and Eq. 2). WW1 and WW2 indicate the World War periods and the vertical dotted lines the change of production regime. Annual number of new compositions (l.a., red) and fraction of new synthesized compounds to the total of new ones (right axis [r.a.], blue) are shown. (B) Distance among compositions of successive years (l.a.; Materials and Methods; and SI Appendix, Fig. S3), box plots of the compositions every 10 y (SI Appendix, Fig. S4) with interwhisker distance accounting for 99.9% of the data, and most popular combinations of elements (compositions) reported in new compounds. Relative frequency of compositions is shown in the r.a. (C) Annual fraction of new compounds containing C, H, N, O, halogens, and platinum metals (PMs). Distributions are convoluted using the moving-average method with a 5-y window. (D) Annual number of new compounds reported in some specialized journals.

