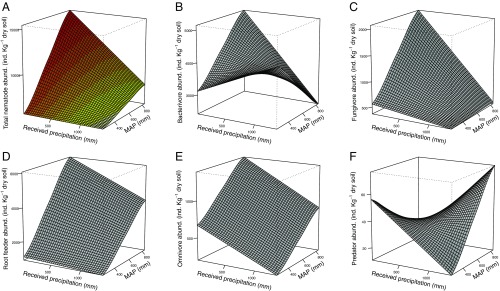
Fig. 1.
Fitted relationships between nematode population abundance and precipitation in space and time. Changes in precipitation through space (z axis), are represented by the mean annual precipitation (MAP) across three sites. Changes in precipitation through time within sites (x axis, Received precipitation) resulted from a combination of variability between years and rainfall manipulation treatments. (A) Total abundance of nematodes (PReceived precip. = 0.0507, PMAP = 0.002, PInteraction = 0.008, r2 = 67.85%); (B) bacterivores (PReceived precip. = 0.001, PMAP = 0.486, PInteraction = 0.014, r2 = 67.17%); (C) fungivores (PReceived precip. = 0.070, PMAP < 0.001, PInteraction = 0.079, r2 = 66.43%); (D) root feeders (PReceived precip. < 0.001, PMAP < 0.001, PInteraction = 0.005, r2 = 50.62%); (E) omnivores (PReceived precip. = 0.059, PMAP < 0.001, PInteraction = 0.909, r2 = 14.13%); and (F) predators (PReceived precip. = 0.004, PMAP = 0.447, PInteraction = 0.607, r2 = 98.66%) explained by received growing-season precipitation and long-term MAP. For all tests n = 240.

