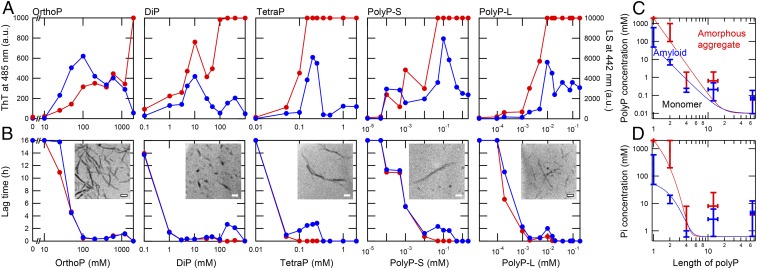
Fig. 2.
Amyloid formation in the presence of various types of polyPs. (A) Maximum values of ThT fluorescence (blue) and LS (red) at acidic pH (10 mM HCl) in the presence of orthoP, diP, tetraP, polyP-S, and polyP-L. (B) Lag times of ThT fluorescence (blue) and LS (red) in the presence of orthoP, diP, tetraP, polyP-S, and polyP-L. Insets show TEM images of amyloid fibrils formed at 100 mM orthoP, 10 mM diP, 0.2 mM TetraP, 100 μM polyP-S, and 10 μM polyP-L. (Scale bars, 200 nm.) (C and D) Phase diagrams for the polyP-induced aggregation of β2m. The aggregation of β2m depending on concentrations of polyP units (C) and inorganic phosphate (Pi) units (D) as a function of the chain length of polyP. PolyP concentrations showing ThT fluorescence of more than 300 (blue bars) and LS exceeding the detection limit (red bars) at acidic pH in A are plotted. The boundary lines between monomer and amyloid and between amyloid and amorphous aggregate are depicted in blue and red, respectively.

