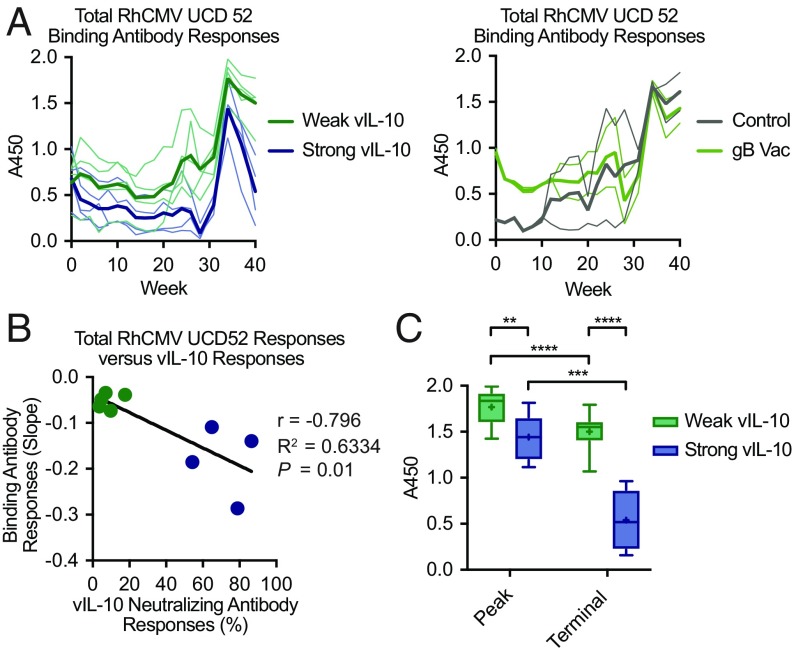
Fig. 4.
Systemic binding antibody responses to total RhCMV UCD52 antigen were compared between macaques that manifested strong vaccine-induced vIL-10–neutralizing antibody responses (blue; n = 4) and those that developed only weak responses (green; n = 5). (A) Longitudinal analyses of UCD52 antibody responses in plasma during the challenge phase of the study were analyzed by ELISA in duplicate. Thin lines display individual macaques within each group, while the bold lines represent mean responses. (B) The slope of the line representing UCD52 binding antibody responses over the final 6 wk of the study (weeks 34–40) was determined for each macaque and compared using a scatterplot. A correlation analysis demonstrated that increased strength of vIL-10–neutralizing antibody responses was associated with a greater decline in RhCMV binding antibody responses. The points represent individual macaques, and the solid line displays a linear regression analysis trendline. (C) Peak and terminal (week 40) RhCMV UCD52 antibody responses in strong and weak vIL-10 vaccine responders were compared. The boxplots with Tukey analysis display the group medians (horizontal lines), the group averages (+ symbols), the interquartile ranges (boxes), and 1.5 times the value of the ranges (stems). The results of t tests comparing these responses are also displayed. **P = 0.0006; ***P = 0.0002; ****P < 0.0001.

