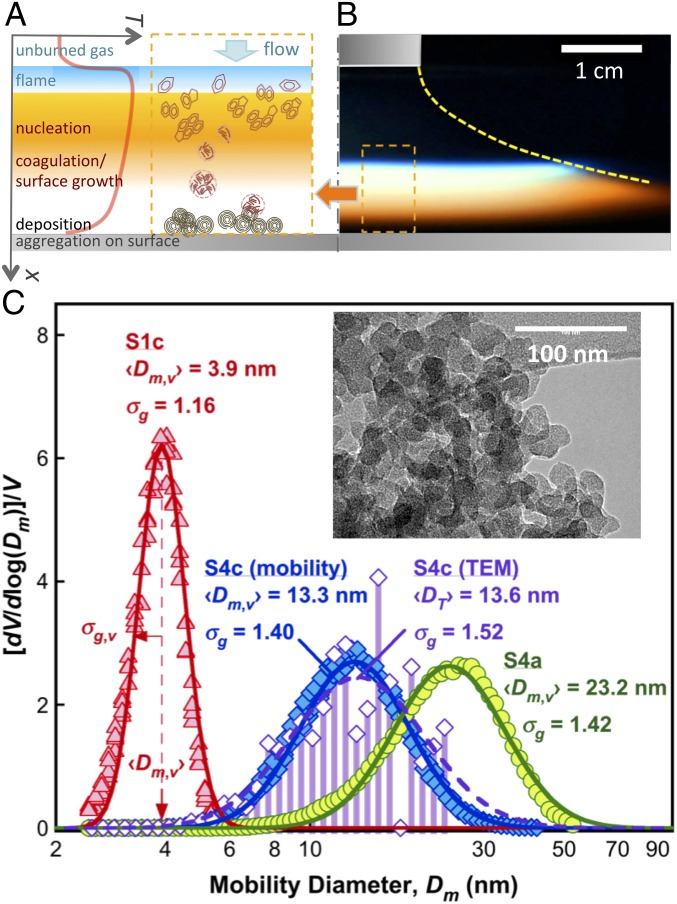
Fig. 1.
CNP preparation method and typical volume size distributions. (A) Schematic showing CNP preparation processes. (B) Image of the premixed stagnation flame. (C) Normalized mobility volume distributions of three samples (filled symbols), covering the CNP sizes studied, from the smallest (S1c), medium (S4c), to the largest (S4a). Solid lines are lognormal representations of the data. (Inset) Typical TEM image for sample S4c. The corresponding TEM primary particle size distribution is presented as a histogram and the open symbols. The size parameters (median diameter and geometric SD σg,v) are provided for comparison. The mobility and TEM volume distributions both assume sphericity, which is appropriate for the primary particles shown here (SI Appendix, section S2).

