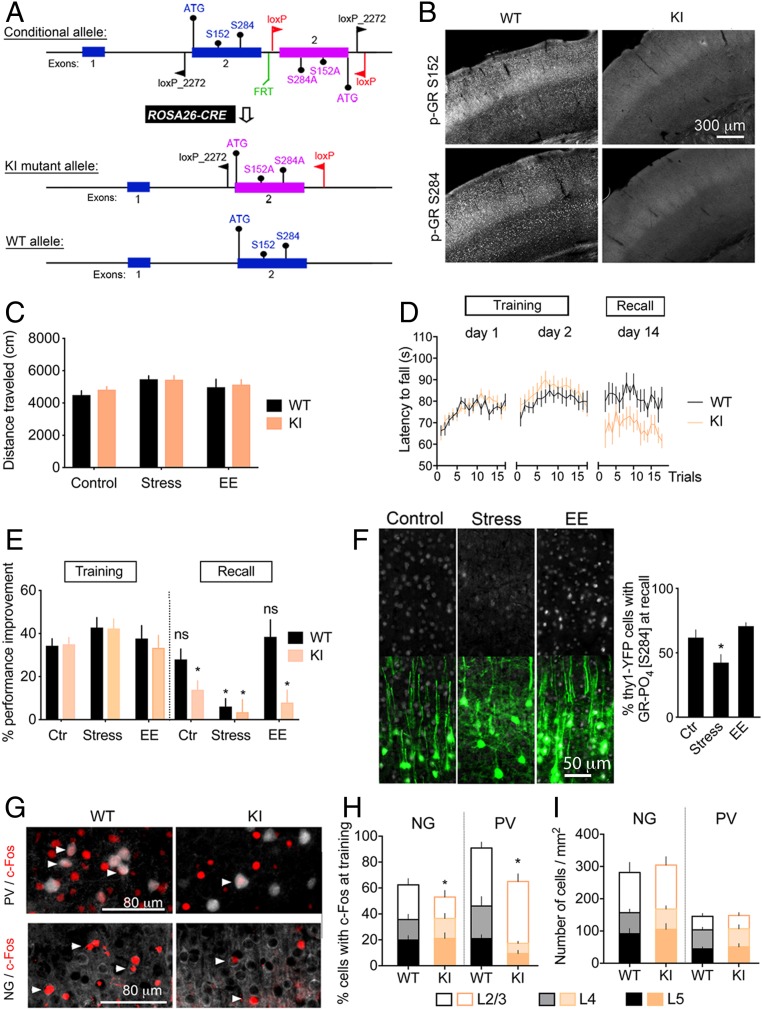
Fig. 1.
Deletion of BDNF-dependent GR-PO4 impairs retention of motor skill training. (A) Substitution of Ser152 and Ser284 (WT allele) by Ala152 and Ala284 (KI allele) in GR locus obtained by Cre-mediated recombination of loxP sites driven by the Rosa26 promoter. KI mice lack BDNF-dependent GR-PO4 sites. Details of the genetic constructs can be found in Methods and SI Appendix, Fig. S2. (B) Deletion of GR-PO4 immunostaining in KI homozygous mice compared with WT controls. (C) Spontaneous locomotion in an open field of mice reared in a control condition, chronic stress condition, or enriched environment (EE) for 2 wk starting immediately after the training. Mean ± SEM of n = 8 mice per group; two-way ANOVA: general effect of living conditions (F2,42 = 3.43, P = 0.039). (D) Motor skill learning monitored after 2 wk of consolidation displayed as the latency to fall from the rotarod. Mean ± SEM of n = 8 mice per group; three-way ANOVA: effect of genotype (F2,2 = 3.075, P < 0.05), post hoc Tukey test: WT day 2 (P = 0.035), KI day 2 (P = 0.017); effect on retention (F1,2 = 11.33, P < 0.05), post hoc Tukey test: KI (P = 0.015). (E) Rotarod performance improvement to day 1 of mice reared in control, stress, or EE conditions for 2 wk after the training. Mean ± SEM of n = 8 mice per group; three-way ANOVA: effect of retention (F1,84 = 52.17, P < 0.0001), genotype (F1,84 = 9.1, P < 0.01), stress × retention (F2,84 = 7.8, P < 0.001), and genotype × retention (F2,84 = 6.55, P < 0.05); post hoc Tukey test between training and recall (*P < 0.05). ns, not significant. (F) Effect of stress and EE between days 3 and 14 on GR-PO4 levels (gray) in Thy1-YFP neurons (green) of M1 cortex. Mean ± SEM of n = 8 mice per group; unpaired t test [t(14) = 2.21, *P < 0.05]. Larger fields of view are shown in SI Appendix, Fig. S2. (G) Expression of c-Fos 45 min after 2 d of training in L2/3 NG principal cells and L5 PV neurons of M1. Arrowheads point to coexpression. Magnified photographs are shown in SI Appendix, Fig. S2. (H) Mean ± SEM of n = 5 mice per group; three-way ANOVA: effect of genotype: (F1,48 = 8.33, P = 0.0058), effect of cell type (F1,48 = 10.95, P = 0.0018), and effect in cortical layers (F2,48 = 31.24, P < 0.0001); post hoc Tukey test for NG cells L2/3 (*P = 0.026), L4 (P = 0.93), and L5 (P = 0.77); post hoc Tukey test for PV cells L2/3 (P = 0.58), L4 (*P = 0.004), and L5 (*P = 0.046). (I) Number of NG and PV neurons per square millimeter in M1. Mean ± SEM of n = 5 mice per group.

