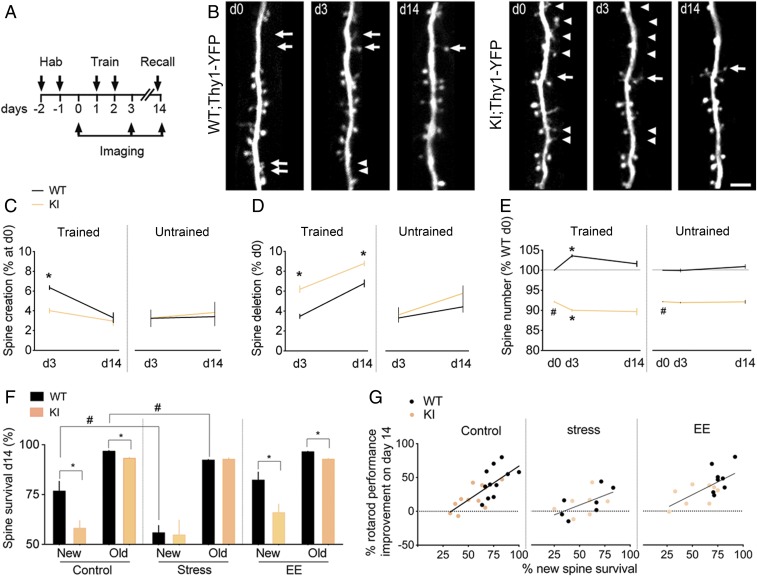
Fig. 2.
GR-PO4 is required for the maintenance of new spines formed at training. (A) Timeline of dendritic spine imaging in M1 cortex of GR-KI;Thy1-YFP mice habituated to the nonaccelerating rod (2 rpm) for 2 d before training at the circadian peak of corticosterone (7:00 PM) on the accelerating rod (up to 80 rpm). A recall session on the accelerating rod is performed before the last imaging session on day 14. (B) Dendritic spine dynamics of L5 principal Thy1-YFP neurons in L1 of M1 as a function of genotype and time. Arrows point to spine creations, and arrowheads point to spine deletions (Scale bar, 5 μm). d, day. (C) Spine creation in M1. Mean ± SEM of n = 20 trained WT mice on days 0–3 and 6 on day 14, n = 18 trained KI mice on days 0–3 and 7 on day 14, n = 6 untrained WT mice on days 0–14, and n = 7 untrained KI mice on days 0–14; three-way ANOVA: effect of genotype × training (F1,69 = 4.39, P < 0.05), post hoc Tukey test: WT vs. KI (*P < 0.0005). d, day. (D) Spine deletion in M1. Mean ± SEM of n = 20 trained WT mice on days 0–3 and 6 on day 14; n = 18 trained KI mice on days 0–3 and 7 on day 14, n = 6 untrained WT mice on days 0–14, and n = 7 untrained KI mice on days 0–14; three-way ANOVA: effect of genotype (F1,69 = 23.28, P < 0.0001) and genotype × training (F1,69 = 5.3, P < 0.05), post hoc Tukey test: WT vs. KI (*P < 0.05). (E) Spine number in M1 relative to WT control. Mean ± SEM of n = 20 trained WT mice on days 0–3 and 6 on day 14, n = 18 trained KI mice on days 0–3 and 7 on day 14, n = 6 untrained WT mice on days 0–14, and n = 7 untrained KI mice on days 0–14; three-way ANOVA: effect of genotype (F1,116 = 2453, P < 0.0001) and genotype × training (F1,116 = 55.18, P < 0.0001), post hoc Tukey test: WT vs. KI (#P < 0.0001) and day 0 vs. day 3 (*P < 0.0001). (F) Survival of training-induced new spines and preexisting old spines in M1. Mean ± SEM of n = 11 control mice per group, 7 stress mice per group; 8 enriched environment (EE) mice per group; three-way ANOVA: effect of stress (F1,64 = 8.1, P = 0.059), post hoc Tukey test: WT (#P < 0.005). Pairwise comparisons by unpaired t test for the effect of genotype on control new spines [t(20) = 2.99, *P = 0.007] and control old spines [t(20) = 6.9, *P < 0.0001] and on new spines EE [t(14) = 2.78, *P = 0.014] and old spines [EE t(14) = 7.93, *P < 0.0001]. Spine addition and elimination data are shown in SI Appendix, Fig. S6. (G) Correlation between survival at day 14 of spines that formed during training on day 2 and memory retention on day 14 in control conditions (Pearson r = 0.73, P = 0.0001, n = 11 WT, n = 11 KI), chronic stress (r = 0.56, P = 0.036, n = 7 WT, n = 7 KI), or EE (r = 0.64, P = 0.0006, n = 8 WT, n = 8 KI).

