Fig. 1.
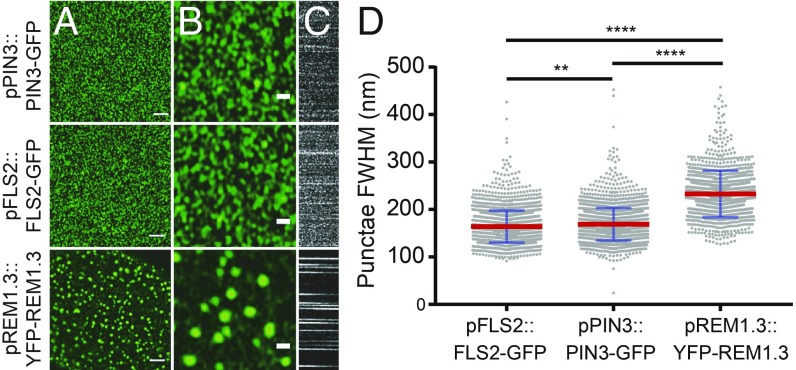
PM proteins form clusters in the hypocotyl membrane. (A) Airyscan imaging of pFLS2::FLS2-GFP, pPIN3::PIN3-GFP, and pREM1.3::YFP-REM1.3 clusters in the membrane of stably transformed A. thaliana (Scale bar, 2 µm). (B) Digitally magnified image of A showing clusters in more detail (Scale bar, 500 nm). (C) Kymographs showing dynamics of each nanocluster in A over time where x = time, y = line profile. (D) Scatter dot plot of FWHM measurement of cluster diameter for PM proteins in A. Nanodomain diameter differs significantly for each protein pair. Red lines show mean value, blue error bars show SD. **P < 0.01 and ****P < 0.0001, ANOVA with multiple comparisons.

