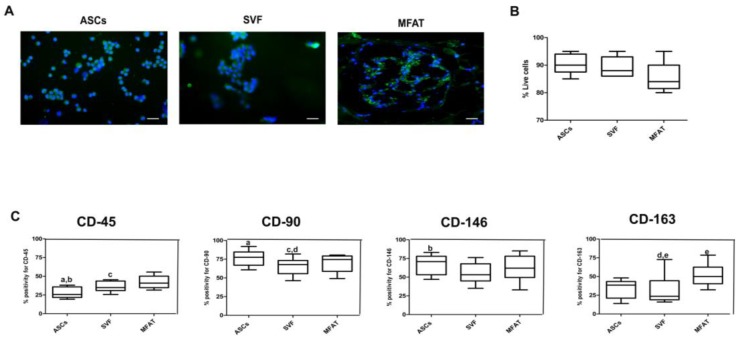
Figure 1.
Viability and characterisation assessments of expanded-adipose stromal cells (ASC), stromal vascular fraction (SVF), and micro fragmented adipose tissue (MFAT). (A) Representative micrographs of Live/Dead analyses; blue staining: nuclei counterstaining; green staining: viable cells; red staining: dead cells; scale bar: 100 µm; (B) Bar graph reporting % of live cells for ASCs, SVF, and MFAT compounds as 95% confidence intervals (CI) of the mean ± standard deviation (SD). (C) Graphical representation of protein expression for CD-45, CD-90, CD-146, and CD-163 in ASCs, SVF and MFAT compounds detected by immunofluorescence analysis. Data are shown at 95% confidence intervals (CI) of the mean ± standard deviation (SD). Data were considered significant with p < 0.05: (a) % CD45 versus CD-90 in the ASC group; (b) % CD-45 versus CD-146 in the ASC group; (c) % CD-45 versus CD-90 in the MFAT group; (d) % CD-90 versus CD-163 in the SVF group; (e) % CD-163 in the SVF versus % CD-163 in the MFAT group.

