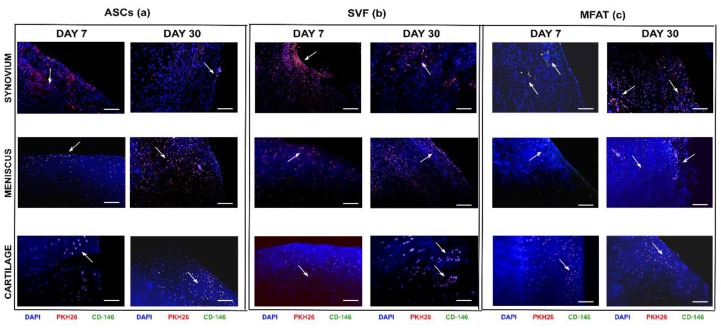
Figure 2.
Representative micrographs of local biodistribution analyses at 7 and 30 days after intra-articular delivery of ASCs, SVF, and MFAT in the synovial membrane, the meniscus and the cartilage in an osteoarthritis (OA) rabbit model. (a) ASCs, (b) SVF, and (c) MFAT. Scale bar: 100 µm. Blue staining: nuclei counterstaining (dihydrochloride hydrate (DAPI) channel); red staining: PKH26 cell-labelling (Tetramethyl Rhodamine Iso-Thiocyanate (TRITC) channel); green staining: CD-146+ cells (with fluorescein isothiocyanate (FITC) channel); yellow staining: co-localization of PKH26+/CD-146+ cells. Black arrows: indications of some co-localized areas.

