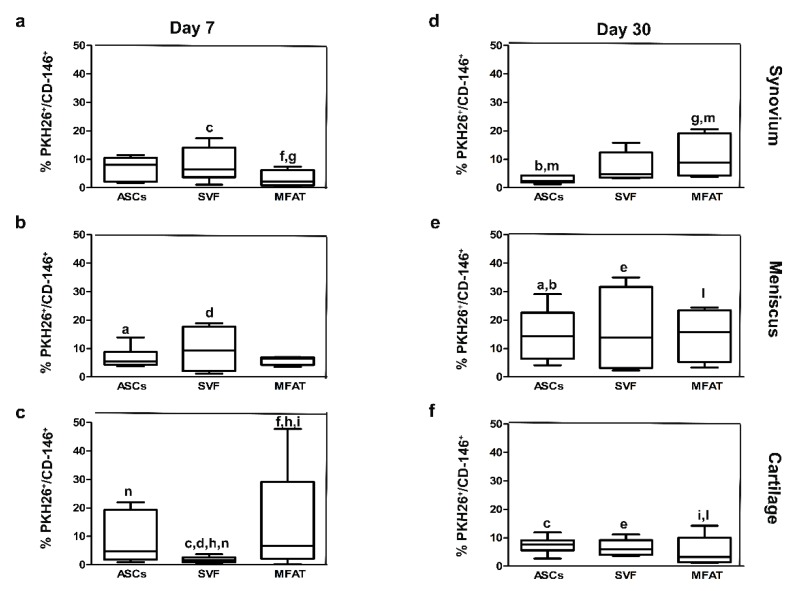
Figure 4.
Graphical representation of the co-localized expression of progenitor cells and PKH26-labelled cells at day 7 (a–c) and day 30 (d–f) after intra-articular delivery of ASCs, SVF, and MFAT in the synovial membrane, the meniscus, and the cartilage. Data are shown at 95% confidence intervals (CI) of the mean ± standard deviation (SD). Data were considered significant with p < 0.05. (a) % PKH26 + /CD-146+ in the ASCs at day 7 versus ASCs at day 30 in the meniscus; (b) % PKH26+/CD-146+ in the ASCs in the synovium versus the ASCs in the meniscus at day 30; (c) % PKH26+/CD-146+ in SVF in the synovium versus SVF in cartilage at day 7; (d) % PKH26+/CD-146+ in SVF in meniscus versus SVF in cartilage at day 7; (e) % PKH26+/CD-146+ in the meniscus versus SVF in cartilage at day 30; (f) % PKH26+/CD-146+ in the MFAT in the synovium versus MFAT in cartilage at day 7; (g) % PKH26+/CD-146+ in MFAT at day 7 versus MFAT at day 30 in the synovium; (h) % PKH26+/CD-146+ in the SVF versus MFAT at day 7 in the cartilage; (i) % PKH26+/CD-146+ in MFAT at day 7 versus day 30 in cartilage; (l) % PKH26+/CD-146+ in MFAT in meniscus versus MFAT in cartilage at day 30; (m) % PKH26+/CD-146+ in ASCs versus MFAT in the synovial membrane at day 30. (n) % PKH26+/CD-146+ in ASCs versus SVF in the cartilage at day 7.

