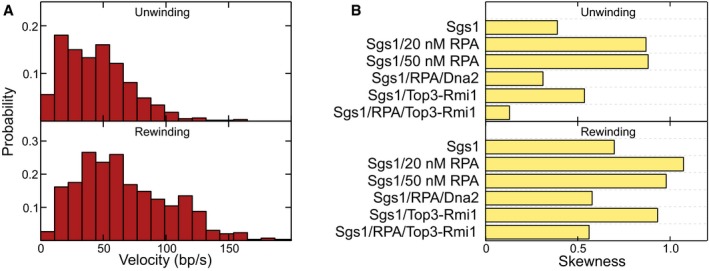
Figure EV1. Skewness of the velocity distributions for unwinding and rewinding for the different protein combinations.

- Histograms of the observed unwinding and rewinding velocities for Sgs1 in the presence of 50 nM RPA. The mean unwinding rate was 46 ± 3 bp/s (N = 597). The mean rewinding rate was 68 ± 3 bp/s (N = 594).
- The skewness was calculated for the data shown in the velocity histograms in the main text.
