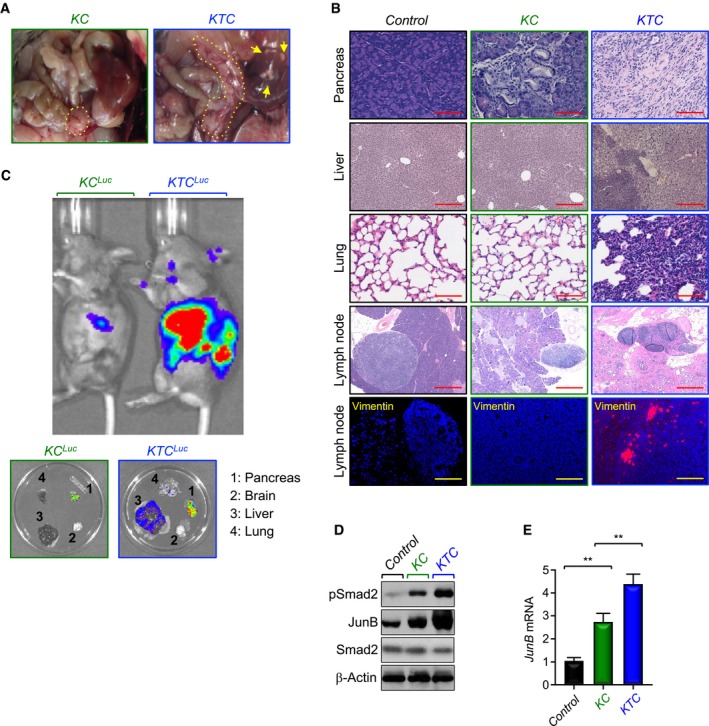
Representative pictures of dissected abdominal region of KC and KTC mice. Yellow arrows indicate metastatic nodules in liver. Yellow dotted lines show the pancreas.
FFPE sections of pancreas, liver, lungs, or lymph nodes from control, KC, or KTC mice were stained with H&E or immunostained with anti‐Vimentin antibody and revealed by IF. Representative pictures at 4× (Lymph node, H&E), 10× (Liver, H&E), and 20× (Pancreas, H&E; Lung, H&E; Lymph node, IF‐Vimentin) are shown (n = 18–30). Scale bars, 1,000 μM (Lymph node, H&E), 400 μM (Liver, H&E), and 200 μM (Pancreas, H&E; Lung, H&E; Lymph node, IF‐Vimentin).
Tumor volume and metastasis in live KC
Luc and KTC
Luc mice were analyzed by IVIS bioluminescence. Following imaging live animals, pancreas, brain, liver, and lung were dissected and analyzed again by IVIS bioluminescence (n = 6, 5 out of 6 mice developed metastasis to liver and lung).
Total cell lysates from pancreas of control, KC, or KTC mice were pooled and analyzed by immunoblotting using antibodies to pSmad2, Smad2, or JunB (n = 6).
Expression of JunB in pancreas from control, KC, or KTC mice (same as in D) was analyzed by qRT–PCR (n = 6). Data are expressed as mean ± SEM. **P < 0.01; based on a two‐tailed Student's test.

