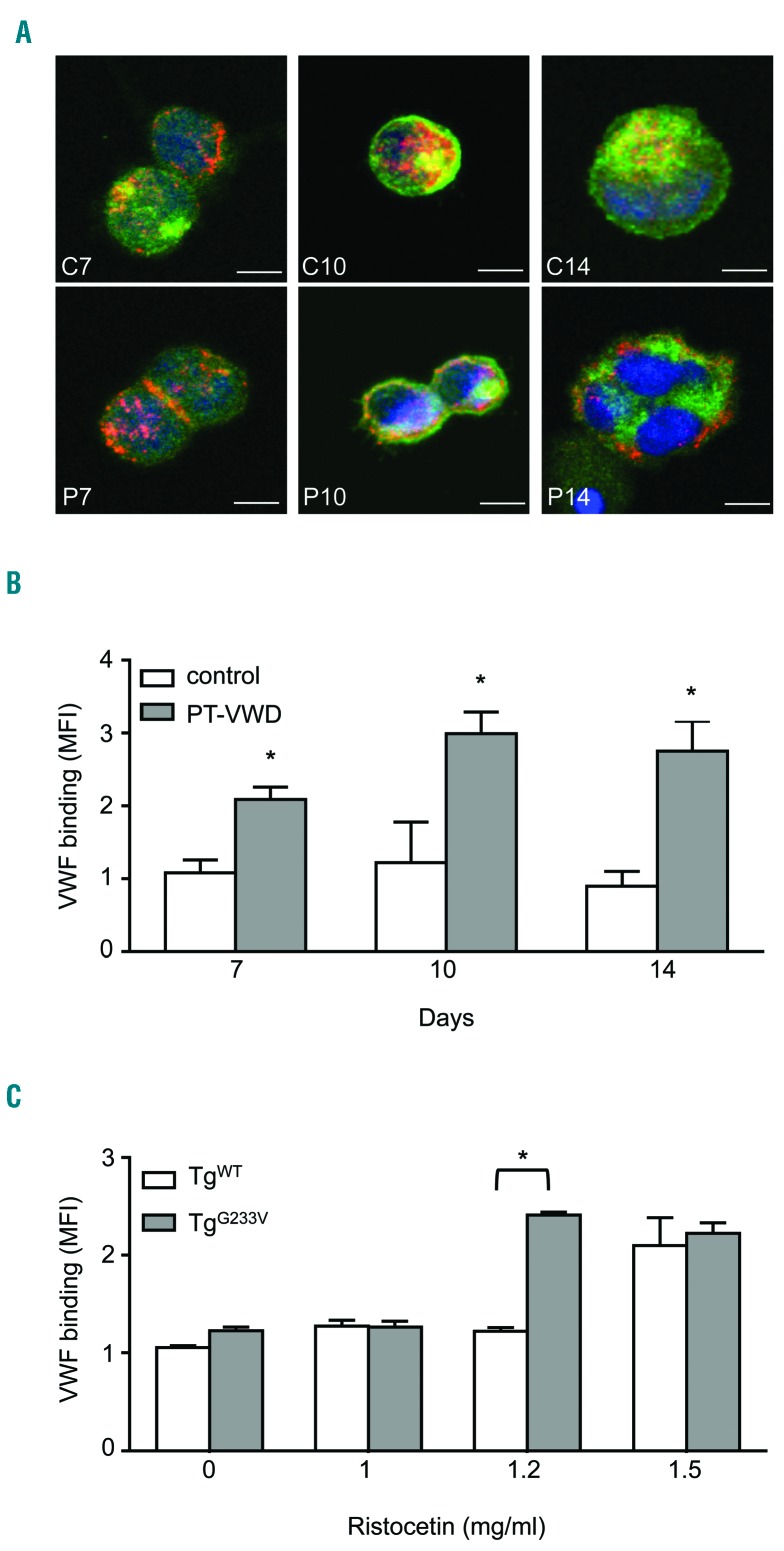
Figure 1.
von Willebrand factor (vWF) binding to megakaryocytes. (A) vWF binding to human megakaryocytes at different days of culture as assessed by confocal microscopy. vWF binding was analyzed by confocal microscopy of megakaryocytes cytospun on glass cover-slips. vWF is stained green (Alexa Fluor® 488 Goat Anti-Rabbit IgG), CD42b is stained red (Alexa Fluor® 568 donkey Anti-mouse IgG), and nuclei are stained blue with Hoechst. Samples were mounted using the ProLong Antifade medium (Molecular Probes) and analyzed at room temperature using a TCS SPII confocal laser system equipped with a DM IRBE inverted microscope and a 40× OIL NA objective (Leica, Bensheim, Germany). Representative merging images are shown. Surface localization of vWF was established by analyzing the intensity of the fluorescence signal along the x-axis on the optical section for each fluorochrome using Image J software. Scale bars=20 μm. P: PT-vWD megakaryocytes; C: control megakaryocytes. Representative images are of megakaryocytes from three controls and of three different preparations from the PT-vWD patient. (B) Binding of vWF (mean fluorescence intensity, MFI) to human resting control and PT-vWD megakaryocytes at days 7, 10 and 14 of differentiation, as assessed by flow cytometry. Data represent mean±Standard Error of Mean (SEM) of five controls and five different preparations from the PT-vWD patient (*P<0.05 vs. control). Raw FACS data are shown in Online Supplementary Figure S11A. (C) Binding of vWF to murine megakaryocytes from TgWT and TgG233V mice at day 4 of differentiation induced by increasing doses of ristocetin, as assessed by flow cytometry. Data represent mean±SEM for five repeated measures (*P<0.05 vs. 0). Raw FACS data are shown in Online Supplementary Figure S11B.

