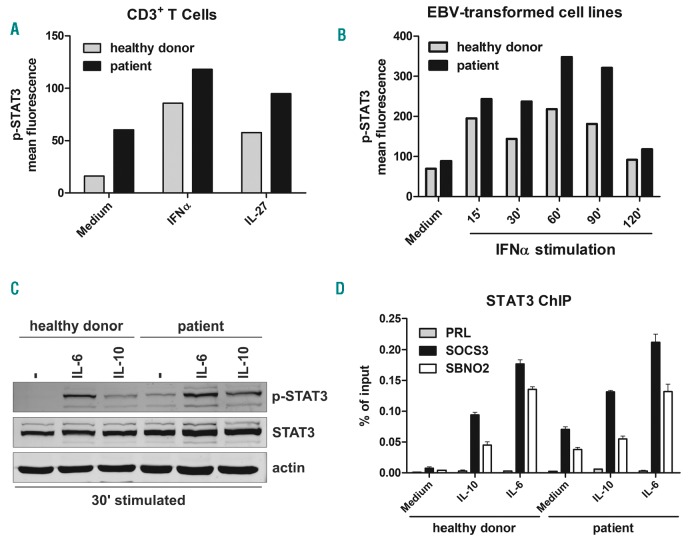
Figure 1.
STAT3 phosphorylation and chromatin immunoprecipitation assay in the STAT3 gain-of-function (GOF) patient. (A) STAT3 phosphorylation in T cells (CD3+ cells) in response to interferon-α (IFNα) and IL-27 stimulation or medium alone. Cells from whole blood samples were lysed, fixed and permeabilized, then stained with anti-p-STAT3 and anti-CD3 antibodies. Extent of p-STAT3 is shown on y-axis as mean fluorescent intensity. (B) Time course of STAT3 phosphorylation of Epstein-Barr virus (EBV)-transformed B-cell lines obtained from a control subject or from the STAT3 GOF patient. Cells were kept in culture with serum free medium overnight and stimulated with IFNα for 15, 30, 60, 90 or 120 minutes. Then, cells were permeabilized and stained with anti-p-STAT3. Extent of p-STAT3 is shown on y-axis as mean fluorescent intensity. (C) Western blot analysis of STAT3 tyrosine phosphorylation in EBV-transformed B-cell lines from a control subject or from the STAT3 GOF patient. Cells were kept in culture with serum free medium overnight and then either untreated or stimulated with IL-6 (200 ng/mL) and IL-10 (200 ng/mL) for 30 minutes. (D) Evaluation, by chromatin immunoprecipitation analysis, of STAT3 recruitment to the SOCS3, SBNO2, IL-10 and PRL promoters of EBV-transformed B cells cultured in the presence or absence of IL-6 (200 ng/mL) and IL-10 (200 ng/mL) for up to 1 hour. Co-immunoprecipitated DNA was expressed as percent of the total input. Error bars represent standard errors calculated from triplicate quantitative polymerase chain reactions.

