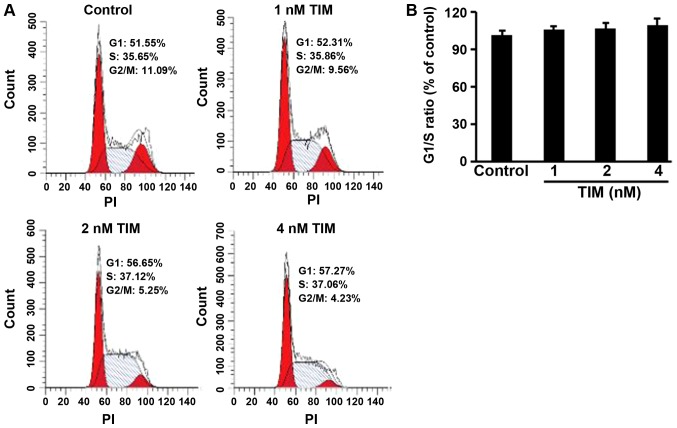
Figure 2.
TIM did not alter the cell cycle distribution of U2OS cells. (A) Representative images of the flow cytometry plots for the cell cycle analysis. (B) TIM did not significantly alter the proportion of cells at G1/S phase, as compared with that in the control group. Data are expressed as the mean ± standard deviation (n=3). TIM, (3R)-5,6,7-trihydroxy-3-isopropyl-3-methylisochroman-1-one; PI, propidium iodide.

