Figure 1.
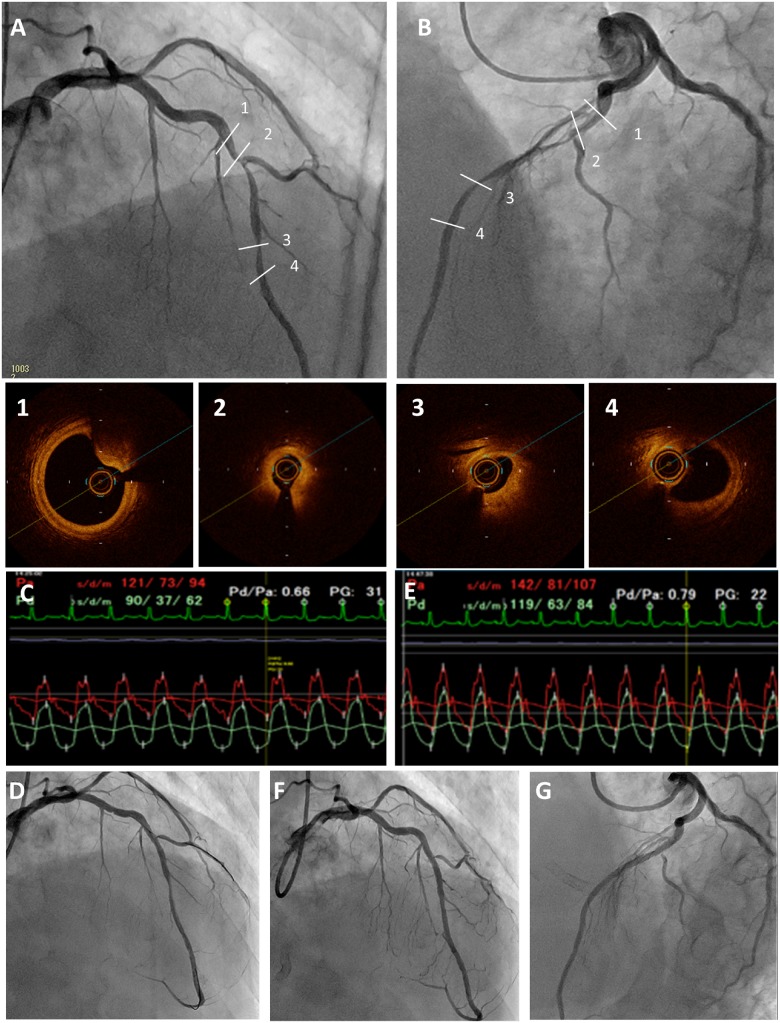
Coronary angiography of 30 right anterior oblique 30 cranial view (A) and 45 left anterior oblique 20 cranial view (B) showing the presence of a tandem lesion in the mid segment of the left anterior descending artery. Optical coherence tomography images showed the proximal lesion in the left anterior descending artery with mild calcified plaque and a reference lumen area of 5.92 mm2 (1), a minimal lumen area of 0.83 mm2 at the proximal stenosis (2), and a minimal lumen area of 1.02 mm2 at the distal stenosis of the mid left anterior descending artery (3). The distal reference lumen area was 2.81 mm2 (4). Pressure loss (ΔP) was calculated from the following equation: ΔP = FV + SV2. The F and S were calculated from the optical coherence tomography data. F is the coefficient of pressure due to viscous friction (Poiseuille resistance), whereas S is the coefficient of local pressure loss due to abrupt enhancement (flow separation). V represents coronary flow velocity. The F coefficient was calculated as the sum of all optical coherence tomography slices, which were 100 μm in longitudinal length. In this case, the F was calculated as 0.221 mmHg s/cm. The S coefficient was calculated using the proximal reference area and minimum lumen area. In this case, the S was calculated as 0.013 mmHg s2/cm2. The stenotic flow reserve in the diastolic phase was calculated using the following formulas: P = 100 − (FV + SV2), P = 10 + V × (100 − 10)/4.2. The intersection point of both formulas was defined as the SFR in the diastolic phase. The SFR in the systolic phase was calculated using the following formulas: P = 100 − (FV + SV2), P = 10 + V × (100 − 10)/2. The intersection point of both formulas was defined as the SFR in the systolic phase. In this case, the SFR (diastolic/systolic) was calculated as 2.36/1.56. The pressure loss in the lesion was calculated using the following formula: FV + SV2. The pressure loss in the diastolic phase was calculated as follows: 0.224 × (20 × 2.36) + 0.013 × (20 × 2.36)2 = 39.5 mmHg. The pressure loss in the systolic phase was calculated as follows: 0.224 × (10 × 1.56) + 0.013 × (10 × 1.56)2 = 6.66 mmHg. [(60 − 39.5)×2/3 + (120 − 6.66) × 1/3]/80 = 0.64. Therefore, the optical coherence tomography-derived fractional flow reserve yielded a value of 0.64. The wire-based fractional flow reserve was 0.66 (C). In the absence of stenosis at the proximal lesion in the mid left anterior descending artery, the optical coherence tomography-derived fractional flow reserve yielded a value of 0.79. Angiography after stent implantation at the proximal lesion (D). The wire-based fractional flow reserve after stenting at the proximal lesion was 0.79 (E). Angiography of 30 right anterior oblique 30 cranial view (F) and 45 left anterior oblique 20 cranial view (G) after additional stenting at the distal segment.

