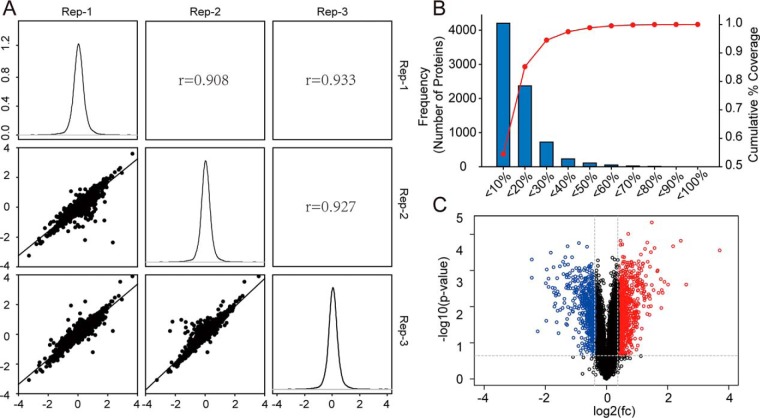
Fig. 2.
Quantitative proteomic analysis of 786-O BAP1 KO cells and WT cells. (A) Histograms showed normal Gaussian distributions of log2(fold change) from proteomic data and high Pearson correlation coefficient indicated high correlation in fold-changes among three biological replicates. (B) About 25% variation corresponded to 88% coverage of the proteomic data, and based on this, the cutoff was set at 1.3 fold (1 ± 30% variation). (C) Volcano plots showed significantly changed proteins in BAP1 KO cells with fold-change > 1.3 (labeled in red) or < 0.7 (labeled in blue) and p value < 0.05.

