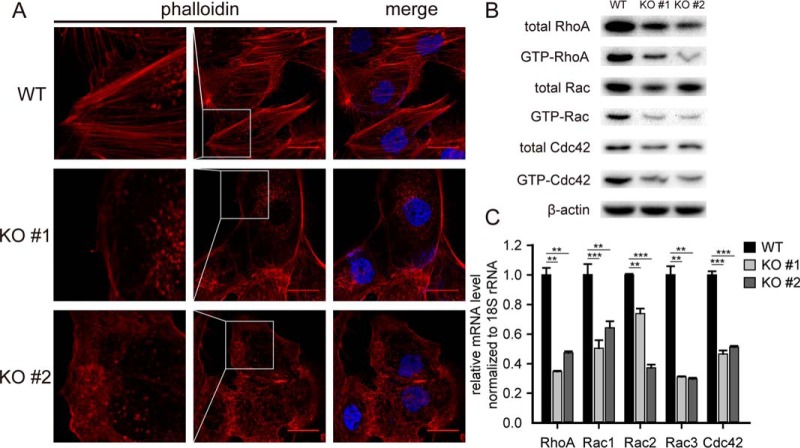
Fig. 6.
BAP1 knockout decreased the formation of stress fibers and membrane protrusions in 786-O ccRCC cells. (A) Staining of 786-O cells with TRITC-phalloidin (red) to observe F-actin fibers. BAP1 KO cells exhibited smooth margins and decreased formation of stress fibers, with disordered actin alignment and reduced pseudopodia. Scale bar: 25 μm, n = 3. (B) Western blotting quantifying the total and active form of Rho family GTPases in 786-O WT and KO cells, n = 3. (C) Quantitative real-time PCR quantifying the mRNA level of Rho family GTPases in 786-O WT and KO cells, n = 3. **p < 0.01; ***p < 0.001.

