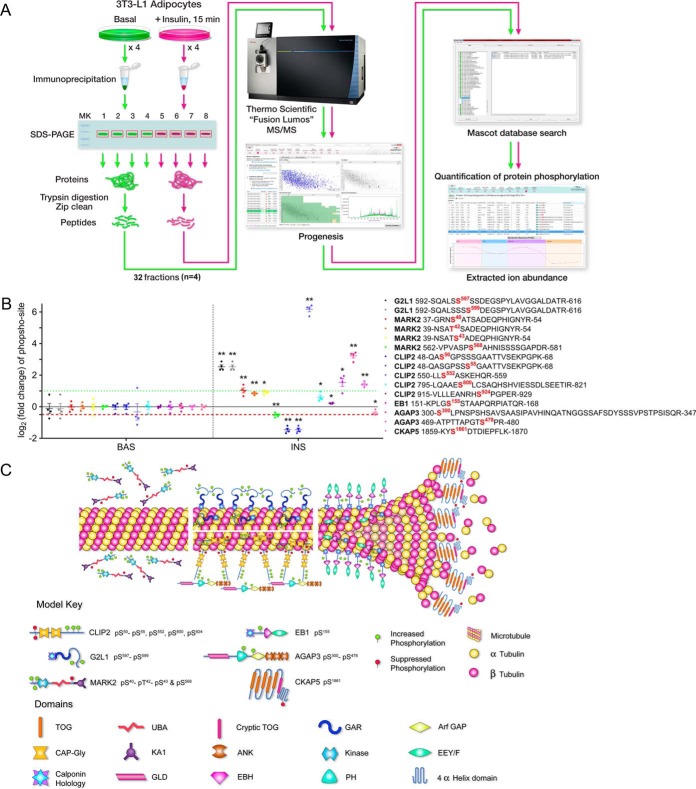
Fig. 1.
G2L1, MARK2, CLIP2, EB1, AGAP3, and CKAP5 undergo insulin-regulated phosphorylation. A, Serum-starved 3T3-L1 adipocytes were either left untreated or treated with insulin, lysed, and target proteins were immunoprecipitated as described under “Experimental procedures”. The IPs were separated by SDS-PAGE and the gel slice corresponding to the protein of interest was excised and subjected to trypsin digestion. The resulting tryptic digest was purified and subsequently analyzed by tandem mass spectrometry. Raw data processing for quantification was executed in Progeneis QI for Proteomics and peptide/protein identification was performed by database searching with Mascot. The resulting Mascot peptide and protein identifications were imported into Progenesis QI for Proteomics and quantification of changes in phosphopeptide abundance was performed via extracted ion abundance in Progenesis QI for Proteomics. MS/MS, tandem mass spectrometry. B, G2L1, MARK2, CLIP2, EB1, AGAP3, and CKAP5 phosphorylation was analyzed as described above and under Experimental Procedures (n = 4 per protein). Phosphopeptides are labeled with both the starting and final amino acid position of the phosphopeptide within the protein, along with the phospho-site (in red). The basal versus insulin data is separated by the vertical dashed black line. The horizontal red dashed line represents a 50% decrease in phosphorylation while the horizontal green dashed line represents a 2-fold increase in phosphorylation. *p ≤ 0.05; **p ≤ 0.01 insulin compared with basal; t test. BAS, basal. INS, insulin. C, The illustration depicts all identified phosphorylation sites affected by insulin, the location of the phosphorylation sites within each protein, the effect of insulin on phosphorylation (increased = green, suppressed = red), as well as the hypothetical localization of the microtubule-regulating proteins respective to the microtubule. TOG, tumor overexpressed gene; UBA, ubiquitin-associated; GAR, Gas2-related; GAP, GTPase-activating protein; KA1, kinase associated domain 1; ANK, ankyrin; EEY/F, EEY/F motif; GLD, GTP-binding protein-like domain; EBH, EB homology; PH, pleckstrin homology.

