Fig. 6.
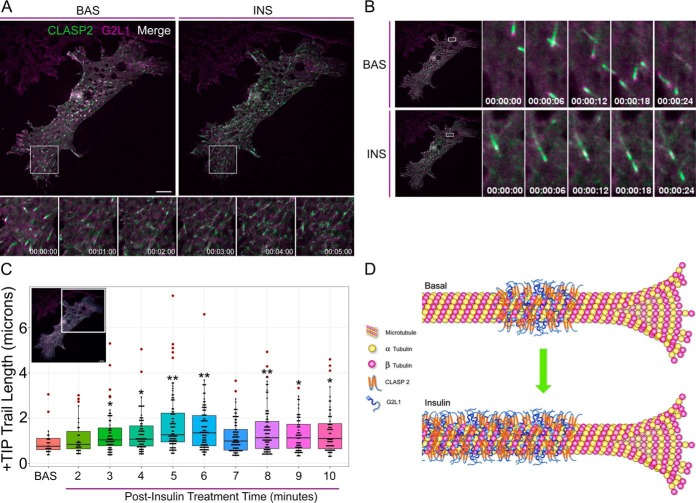
Insulin stimulates CLASP2 and G2L1 microtubule plus-end cotrailing. Live-cell imaging of adipocytes cooverexpressing GFP-CLASP2-HA (green) and mCherry-G2L1-myc (magenta). Adipocytes were serum starved for one hour and subsequently stimulated with 100 nm insulin. Live cells were imaged using TIRFM on a two-second acquisition interval and the displayed time series were extracted from supplemental Video 4. A, Image of entire cell in the basal state (left panel) or 8 mins post insulin treatment (right panel). Time series images under the whole cell image are used to highlight insulin-stimulated +TIP dynamics within the indicated ROI. B, Time series of the indicated ROIs at either the basal state or at 3 mins post insulin treatment to present an example of changing CLASP2 and G2L1 plus-end dynamics with insulin stimulation. C, Live cell +TIP dynamics of the ROI were captured in the basal state followed by stimulation with insulin. Each insulin-stimulated +TIP trail length time point was compared against the basal +TIP trail length to test for significant differences. t test; *p ≤ 0.05, **p ≤ 0.01. Red circles represent outlier data points. ROI, region of interest. BAS, basal. INS, insulin. Scale bar = 10 μm. D, A model depicting the insulin-stimulated shift of CLASP2 and G2L1 from growing plus-end microtubule localization to “trailing”, a behavior characterized by CLASP2 and G2L1 decorating the trailing microtubule lattice behind the growing microtubule plus-end.

