Fig. 7.
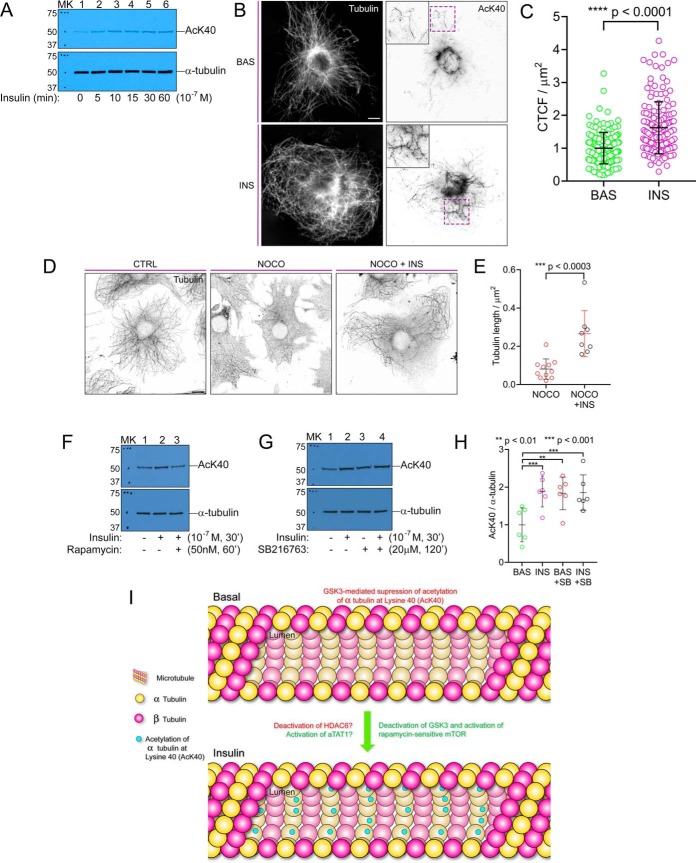
Insulin stimulates acetylation of α-tubulin at Lysine 40 and microtubule stabilization. A, Serum-starved 3T3-L1 adipocytes were either left untreated or treated with an insulin time course for the times indicated. Adipocyte lysis was performed as described under “Experimental procedures”. The whole cell lysates were resolved by 10% SDS-PAGE and transferred to nitrocellulose membranes. The membranes were subjected to Western blotting with the antibodies indicated. Representative blot, n = 3. MK, protein ladder marker. AcK40, α-tubulin acetylation at lysine 40. B, Immunofluorescence images of the effect of insulin (30min, 100 nm) on serum-starved adipocytes. Cells were fixed and immunolabeled for α-tubulin (white) and AcK40 (inverted white). Scale bar = 10 μm. C, Quantification of AcK40 in adipocytes at basal state or 10 mins following insulin stimulation indicates increased AcK40 after insulin treatment. The images were quantified for corrected total cell fluorescence (CTCF) as described under “Experimental procedures”. Quantification was based on data collected from 25–40 cells per condition. The images are representative of five independent experiments. Error bars represent ±S.E. and statistical comparison was made by unpaired parametric t test. D, Immunofluorescence images of the effect of insulin (30min) on nocodazole-induced microtubule depolymerization in serum-starved adipocytes. Cells were left untreated or treated with either 2 μm nocodazole alone for 15min or 100 nm insulin for 30 min followed by 2 μm nocodazole for 15min, fixed and immunolabeled for α-tubulin (inverted white). CTRL, control, NOCO, nocodazole. INS, insulin. Scale bar = 10 μm. E, Quantification of microtubule density in adipocytes indicates insulin treatment results in resistance to nocodazole-induced microtubule depolymerization. Quantification was based on data collected from 8–11 cells per condition. The images are representative of two independent experiments. Error bars represent ±S.E. and statistical comparison was made by unpaired parametric t test. F, Serum-starved 3T3-L1 adipocytes were either left untreated or treated with either insulin alone or insulin together with rapamycin pretreatment to inhibit mTOR. Evaluation of AcK40 was performed as described above in A. G, Serum-starved 3T3-L1 adipocytes were either left untreated, treated with SB216763 alone (a GSK3 inhibitor), treated with insulin alone, or treated with insulin together with SB216763 pretreatment. Evaluation of AcK40 was performed as described above in A. H, Six experiments as performed in G were quantified by densitometry to evaluate the effects of SB216763-mediated inhibition of GSK3 on AcK40. The AcK40 signal was normalized to the total α-tubulin signal on the western blots. These values were then normalized by the mean value of the basal sample and then expressed as a fold change over basal ±S.E.; t test. SB, SB216763. I, In this proposed hypothetical model, GSK3 suppresses the acetylation of α-tubulin at lysine 40 (“AcK40”) in the basal state. Insulin deactivates GSK3 and stimulates AcK40 through rapamycin-sensitive mTOR.

